Overview
The introduction of Microsoft Teams to a wide audience has become a real breakthrough in terms of collaboration opportunities. Unfortunately, it’s not uncommon for the potential of Microsoft Teams to be suppressed by age-old problems, such as lack of knowledge, inactive Microsft Teams groups acting as a dead weight, and so on.
Even though Microsoft Teams is a rather flexible platform, it can still become rather problematic to manage all of the different groups at once, especially when some of them are no longer active in the first place. There’s also the fact that some of the groups might just be temporary in the first place, and they’ll stay unused after their purpose is served.
Microsoft Teams reporting feature
The obvious way out of this problem would be to clean up inactive groups on a regular basis – and, luckily enough, Microsoft Teams does have the toolset to help you with that – it’s their Microsoft Teams usage report. It can be used to get a quick recap of how many people are using specific features of Microsoft Teams, the number of active users, channels, and messages in general, and similar numbers for each separate team.
It is worth noting that generating reports for Microsoft Teams requires users to have a specific status or role: either reports reader, global admin, or product-specific admin. These are the only roles that have access to a Microsoft Teams Admin Panel and thus are capable of generating these reports – even the channel owner role does not have such permissions.
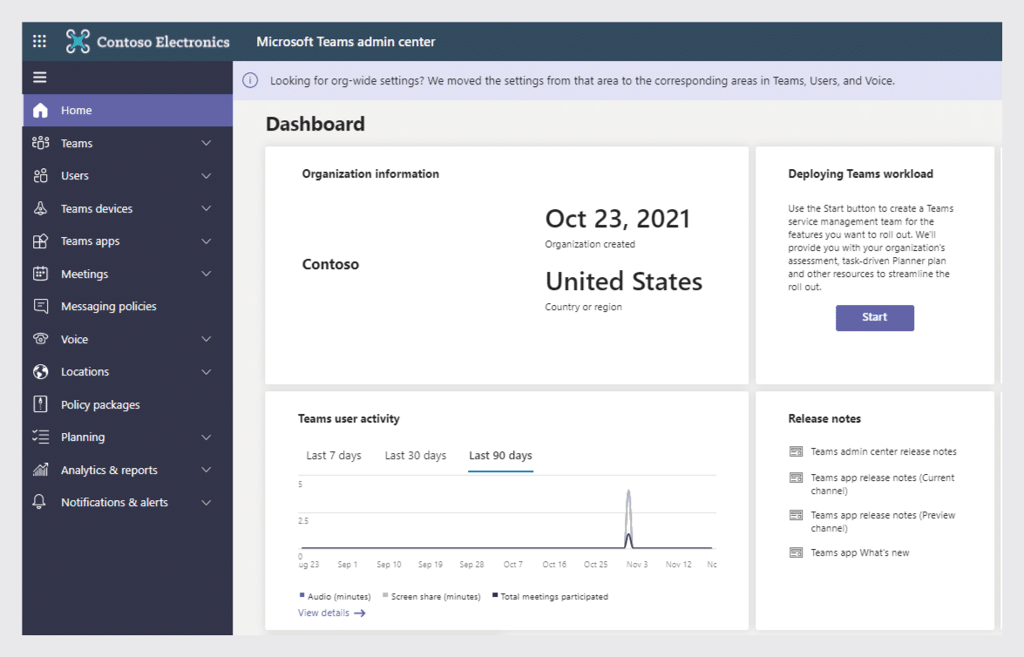
Teams usage reports can be generated using the Usage Reports tab, located under the Analytics & Reports section of your Microsoft Teams admin center. After that, you’ll see the Analytics & Reports page with two tabs available – View reports and Downloads. The purpose of both of those tabs should be relatively obvious.
To generate a new Microsoft Teams usage report, you’ll have to select it under the Report section of the page.
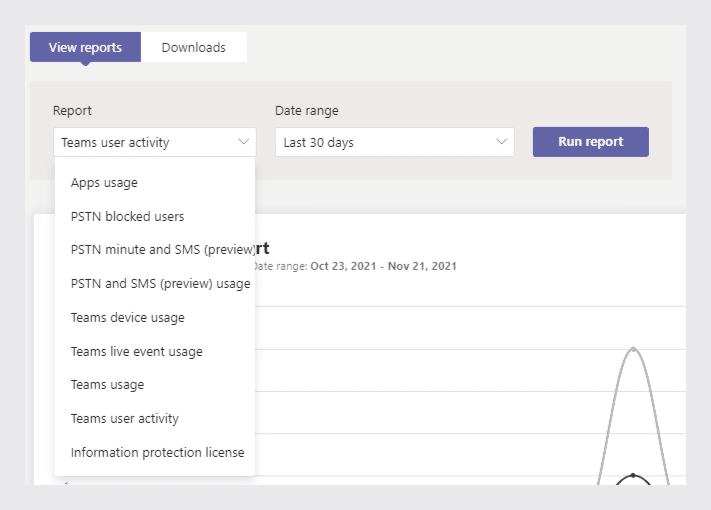
There are also several other options available for this feature, such as:
- Teams device usage – a report on which devices Microsoft Teams users are using to connect to Teams; capable of grouping information into different device types and listing each user’s activity history when it comes to accessing Microsoft Teams with different devices.
- Teams user activity – presenting information on different types of activities that your Microsoft Teams users are performing, including unscheduled meetings, scheduled meetings, participation rates, chat communication statistics, and more.
- Teams live event usage – activity overview in regards to various live events performed in your organization, including event status, view count, event start time, production type, and many other parameters.
- Apps usage – as the name suggests, this report is focused strictly on which applications are used by your Microsoft Teams users, how much they are used, who is the creator of said app, multiple filtering options, and other information
- PSTN blocked users – a list of Microsoft Teams users who are blocked from making PSTN calls, as well as the reason for blocking, the personal phone number of each user, and more.
- PSTN minute and SMS (preview) pools – an overview of both calling and audio conferencing activity within your company, with parameters such as the number of minutes spent on those activities, license usage by location, the total number of minutes available, and more.
- PSTN and SMS (preview) usage – a slightly different approach to an overview of audio conferencing and calling activity in your company, includes both Calling Plans if Microsoft is your carrier and Direct Routing if you’re using another carrier.
- Information protection license – reserved for specific apps that have subscribed to change notification events to listen to either updated, generated, or deleted messages at the level of a tenant (includes either /chats/getAllMessages, or /teams/getAllMessage), only happens when the user in question has the license to perform such actions.
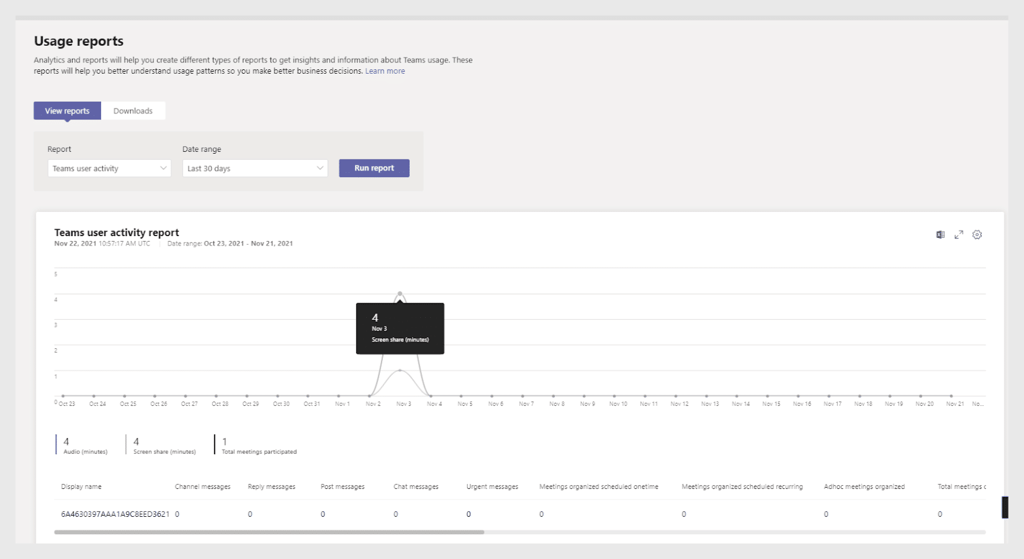
Teams usage report and you can also choose the timespan for this report – be it 7, 30, or 90 days. To generate this report, click the Run Report button.
This generates a variation of the Microsoft Teams reporting dashboard, with both the diagram in the middle and a list of Teams groups below it. It can also be customized to your liking in several different ways. For example, after the initial generation, you’ll be able to see:
- Post messages
- Active channels
- Mentions
- Total active users
- Reply messages
- Channel messages
All of those are presented in a single diagram as a centerpiece of your report. However, you have the ability to filter out some of these parameters by clicking on them under the diagram in the so-called legend section. Additionally, there’s an entire list of your Teams groups under said diagram, offering you a detailed breakdown of how many channels, guests, and messages each of those groups has.
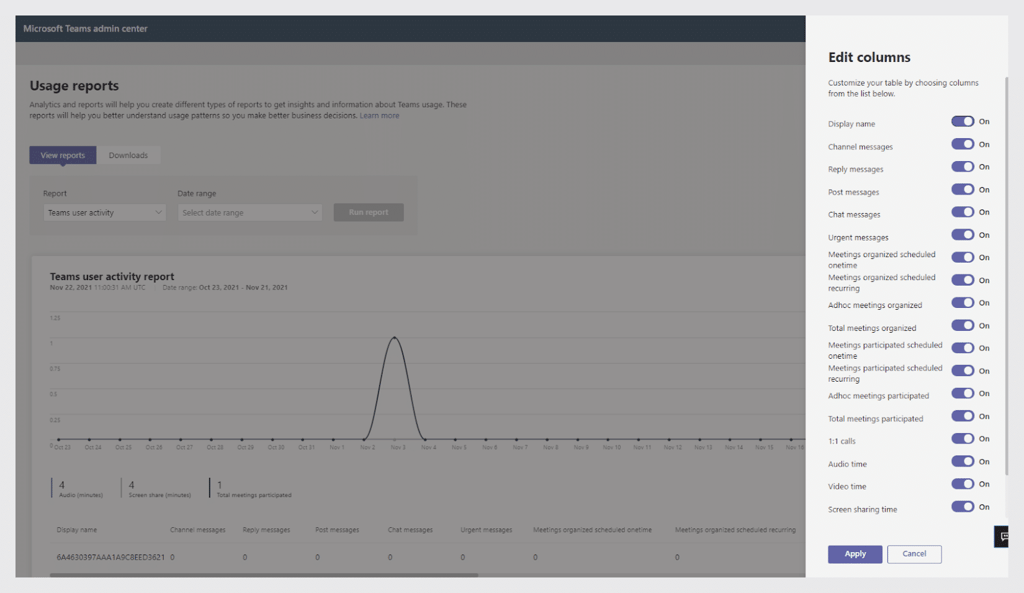
There are also more categories that you can add to this list, such as mentions, reactions, meetings organized, and more. You can enable or disable each and every one of them by clicking the gear icon in the upper-right part of the page. Below we’ve presented a screenshot with an abundance of columns available for Teams user activity report – Teams usage report works in a similar fashion. While we’re there, it’s also possible to export your entire report to Excel (clicking the Excel button near the Settings button)
While the Teams usage report is rather helpful if you only need the basic information about your organization’s statistics in Teams. However, it may not be enough to draw a definite conclusion about how successful or productive your Teams groups are or which ones are inactive/obsolete.
Another issue that you might not even notice with the Microsoft Teams reporting dashboard is that it only goes as far back as 90 days, meaning that if a specific group was not active for more than that – this report won’t show you anything about it whatsoever.
As we’ve mentioned before, there are several different types of reports that Microsoft Teams can generate for you, aside from the general usage reports – user activity, device usage, app usage, and more. However, it’s also not the only way to generate reports about your Teams-related activity.
Another way to have a dashboard serving as an overview of the recent activities within a specific channel can be accessed using Microsoft Teams mobile applications. Both Android and iOS versions of Microsoft Teams have a “Dashboard” tab for each chat/group, which serves as a nice informational page about this particular chat activity.
This kind of Microsoft Teams dashboard is capable of presenting quite a large list of different information types. For example, you can use the Microsoft Teams dashboard to find recent photos, files, and links of a particular chat, as well as shared locations, mutual task lists, planned events, chat details, and more.
It is worth mentioning that the “Dashboard” button is supposed to appear only in cases where Microsoft Teams is used either as a personal messenger or by small businesses. In other cases, corporate Microsoft Teams users might see a different button called “Files,” – which is pretty much the same as “Dashboard,” but without any categorization, it is just a list of the files and photos that were shared recently within the said chat.
Microsoft 365 reporting feature
Another way to view some of your Microsoft Teams activity is to use the reporting feature that Microsoft 365 has. It can be found in Microsoft 365 admin center in the Usage tab under the Reports category. The Usage page allows you to select from a number of possible reports, but you’ll be able to see that there are only two options that are available under Microsoft Teams: user activity report and device usage report.
Let’s choose the user activity report and look at how it’s presented in slightly more detail. In fact, most of the differences between this and Microsoft Teams-based report is in visuals since both of those services offer you a relatively similar Microsoft Teams reporting dashboard – with a diagram as a centerpiece of the report and a list of groups/names under it for more details.
Both allow you to filter out parts of a diagram by clicking on them in the so-called legends tab, and most of the columns can be turned on and off, as well.
The main difference here would be in the type of report chosen – unlike Teams usage report, Teams user activity report shows a list of activities combined with a number of users that have performed said activity in a specific period of time. By the same logic, Teams device usage is also different since it focuses on types of devices that were used for specific actions in a period of time.
Another notable difference is that Microsoft 365 allows you to switch between different time periods without generating the entire report from scratch – you can always switch between 7, 30, 90, or 180 days of coverage at any time.
Need apps for Microsoft Teams?
Integrate powerful tools to streamline your work.
Other means of Microsoft Teams reporting
It would be unfair to say that there are only those two options available when it comes to collecting reports from Microsoft Teams. There are many different options out there, including both the built-in solutions (there’s a separate page with group statistics inside of the Manage team option within Microsoft Teams, as well as cross-team analytics), as well as various third-party solutions.
The combination of several Microsoft services could also be a potential use case for your Microsoft Teams project management dashboard needs. For example, let’s say you might want to insert a self-updating Excel dashboard into your Microsoft Teams environment. You’ll have two main ways to perform such a task.
The first approach is all about embedding an Excel dashboard into your Microsoft Teams environment using a feature called “build-in tabs.” These tabs can be added by both members and owners, it can be done by clicking a button called “Add a Tab” on top of a channel and then choosing an application in question – in our case, it’ll be Excel workbooks. After that, we can choose the Excel file we’ve already uploaded into a Microsoft Teams library and view it as a dashboard inside Teams.
Another less obvious alternative is to create and use a PivotTable inside Excel since the original Excel dashboards cannot be added to Microsoft Teams if they’re not uploaded to the document library but hosted somewhere else. The addition of a PivotTable allows our dashboard to be added in Teams as an external source of sorts.
There are many cases when third-party analytical tools would actually be preferable. For example, even though all of the reporting options have a significant delay (reports requested on Nov. 3rd would only include data from Nov. 1st and everything before that day) – Microsoft 365’s usage analytics have a delay of an entire month or even longer.
Additionally, it’s not uncommon for third-party tools to have more options and details when it comes to Teams reports, in general. The important step here is to choose one method (or one specific third-party software) of reporting that you’re going to be using in the future since consistency is also incredibly important, and different approaches to report generation could provide different results, adding confusion and misinformation in the mix.
Microsoft Teams CQD
Not all of the information and reports are about user activity, either. There’s also another massive part of Microsoft Teams that needs its own analytics and dashboards, and that is making calls.
The thing is, in the last few years, Microsoft Teams pretty much replaced the internal communication systems for a lot of different companies due to pandemic-related restrictions requiring people to work remotely. This led to a large number of issues with connection quality since what was always a set of standard appliances to make calls became a highly inconsistent network of different ISPs, microphones, cameras, and so on.
The main purpose of CQD (Call Quality Dashboard) is to analyze the information that is available about your employees’ calling settings to try and figure out what is the source of bad call quality. The dashboard itself can be generated in the Microsoft Teams admin center in a separate category, and it can help with detecting more obvious call quality issues, reviewing trends related to call quality, and more.
Unfortunately, while helpful in its own way, Microsoft Teams CQD is often not enough to figure out a specific problem or to see information on a specific user – since the insight into what the system can detect about the user’s calling environment is somewhat limited.
A potential situation is if the corporate VPN that the employee in question is obligated to use requires a connection to a specific server that is extremely far away from the employee’s current location, drastically increasing the number of potential connection troubles that can arise.
Additionally, It would be downright impossible to detect that all of your employee’s call-related issues are happening because of an internet connection shared with a Playstation 5 that is always on and is always downloading games for a family member to play.
As with most Microsoft products, CQD does what is needed to provide useful insight for the majority of use cases – but it’s not enough to investigate such problems that are far more unique and case-by-case. This is another argument why relying on a third-party reporting solution has the potential to offer more insight into the situation, at least when it comes to call-related problems.
Third-party tools for Microsoft Teams reports and dashboards
Since we’ve mentioned third-party solutions quite a while before, it’s only fair to go over a few examples of such solutions that should provide more insight and/or tools for you to use in your Microsoft Teams environment. In this case, we’ll be looking over three examples from three different software providers: Voleer, Beesy, and eG Innovations.
Voleer offers a sophisticated set of features for your Microsoft Teams environment, including user adoption statistics, channel archival operations, and the ability to merge channels together. Additionally, Voleer’s solution can be used to provide a plethora of activity-related information via a detailed MS Teams dashboard, the ability to detect inactive groups and groups with no owners, and a plethora of other features.
Beesy, on the other hand, is more about specialized and customizable reports in the first place. You can use their solution to generate your own dashboards about a specific topic and customize parts of the said dashboard – activity ratings, goal-related activities, visualization for dashboards, and more. Additionally, Beesy allows for on-demand reporting with the use of its artificial intelligence, which allows detailed reports to be generated with a single request.
eG, Innovations goes for a somewhat more detailed approach, with their solution eG Enterprise offering a dedicated Microsoft Teams reporting dashboard that provides information on various Teams metrics – from the number of active users and the preferred device types to the number of poor calls and the information about the most used call stream. Each of these parameters could be expanded upon, offering additional information on the subject, be it overall MS Teams service health or a specific topic, such as the Call Quality Analytics tab.
Our last example is one of the solutions we’d imagine could help with a CQD-related problem we’ve discussed above – since this Call Quality Analytics tab alone offers a wealth of knowledge about the calls, such as stream ratings, average call duration, issues reported, failed calls, reasons for poor calls, and more.
Microsoft Teams charts and business approach
As a part of the working process, to analyze efficiency or to get a helicopter view of the project, a common practice is to use charts.
Data analysis on this market can be performed using many different tools and software appliances (link to the 1st post), but the main obstacle to using the analytical tools to their full capacity is the need to manage additional services on top of dozens of those you already use and learn additional interfaces to operate with data.
This necessity goes counter the evolution of tools and services of the modern era. The key to success these days is to integrate services into each other that deep so people would operate in a single window.
This single-window operation philosophy is all-embracing and is essential to the sphere of data analytics. Make it simple and give it to me when and where I need it. As a center of single-window work in the Office 365 platform, Teams becomes an interesting platform to integrate various analytical tools.
But you would also like to know some parts of the analytical information. The majority of the existing analytical tools are built standalone from Microsoft 365. It implies the need for double identification, transfer, storage, and processing of your data on their premises, and in many cases, it’s just a page that standalone service added to the Teams. Data-wise, security-wise, the services are standalone.
Technically, there are several ways to integrate analytics and charts into your teams:
- you can add a dashboard to the Teams group in a separate tab,
- add a dashboard to 1:1 teams chat,
- create a bot to receive data for the person who adds the bot only
- or run a webhook/bot to send the analytical data to the Teams feed.
If we take Google Analytics, a world-known platform for online statistics, one would imagine that the most useful addition to teams would be to attach a customized dashboard. But instead, Google can only send aggregated updates to the channel feed, something that they can also do by e-mail.
It’s actually not as unreasonable as you might think. When you deal with standalone tools that are integrated into Teams, one of the most challenging pieces is permissions management. Third-party tools cannot easily find out the permissions users have in Office 365 and Teams. There are ways to match accounts but in a software world, any solution that is technologically challenged represents risks, and if you are a big company, accidental access to those who don’t need the data or lack of access to those who are not acceptable. So, Google cannot risk allowing me to share its live charts in a Microsoft Teams tab. And forcing anyone to sign in to a Google account to view the chart attached is not handy at all.
In addition, many third-party tools sell their tools on a per-user base and are not interested in sharing a dashboard through Teams as a proxy, so one person could get a license, and then the whole company can use the insights.
A great response to those challenges is SharePoint-native analytical solutions and charts. Developed by Microsoft 365-certified professionals, these solutions keep your data on your side, use your SharePoint or Teams permission management model, and give you a truly integrated single-window work experience.