SharePoint has been around for a while now – and yet it is still one of the most important tools for many businesses and enterprises, offering all of the different capabilities of a web-based collaborative platform. SharePoint dashboards, for example, are pretty much unparalleled when it comes to the various tasks of centralized administration.
The purpose of a SharePoint dashboard
A dashboard in SharePoint allows companies to evaluate data from multiple sources in a form that is easy to understand and work with. The main purpose of a dashboard is to display KPIs, or Key Performance Indicators, which usually require locating and aggregating data in real-time from multiple sources.
Since there are two different versions of SharePoint in the first place – Online and on-premise – it’s important to say that SharePoint Online users are in a much better position when it comes to aggregating information for dashboards. This is because all of the calculations are performed on the server-side – and not on the company’s own servers, as it would’ve been for SharePoint versions that are deployed on-premise.
It’s the main goal of a dashboard to be quick, responsive, and agile, to help stakeholders with time-sensitive decisions after seeing the entire picture of a business, with all of its positive parts and bottlenecks. From that perspective, SharePoint Online seems like a better choice that is way harder to overload with calculations and aggregation tasks.
What data to show on a dashboard?
While dashboards, in general, are quite important on their own, there is one factor that is crucial for those dashboards to even exist in the first place – and that is data. Many experts consider dashboard creation a much harder process than generating said dashboard in SharePoint.
The point of the dashboard in SharePoint is not to create a bunch of indicators, graphics, and success numbers. Dashboards have to have representative information with sources, and this information has to be related to your goals, your future plans, your current status as a company, and so on.
At the same time, you have to be as objective as possible, since it’s the information that could be the basis for the future of your entire company. This is why you have to identify data that would be representative of your company’s future – information that the entire team should be aware of, including metrics, numbers, and so on.
For example, it’s a good idea to start with something that represents your business from the brightest possible angle, be it revenue, number of completed support tickets, number of employees, and so on. This can serve as your starting point, from which you can look at other factors that influence your highest denominator.
If it’s revenue – the factor that would have an influence on that might be something like the number of generated leads, for support ticket numbers – training and education, for onboard employees – a number of employment offers, and so on. Other metrics can also influence these factors, and so on, and so forth.
Excel and third-party dashboard tools for SharePoint
Now that we’re done with what numbers would look like, it’s time to start working on the visuals of your dashboard. Surprisingly enough, one of the easiest ways to create a dashboard in SharePoint is to lay out all of the data in Excel and then upload said file to SharePoint.
On its own, Excel offers a plethora of ways to generate various charts and other means of content visualization. It’s not uncommon for people to run out of ideas when it comes to visualizing their information, which is why there are also many different examples of charts and dashboards all over the Internet.
Once you’re done with displaying all of the info within Excel, it’s time to transfer it all into SharePoint. In our example, we’ll be going with SharePoint Online, which is the most likely example.
The first step you have to take is to upload your Excel dashboard into your SharePoint document library. After doing that, we also have to make sure that our newly-uploaded Excel file has its cursor set in cell A1 to avoid incorrect page display problems. After confirming that, you’re free to save and close the file in question.
You can also change permissions of this dashboard before saving it, too – as well as create a page that your future dashboard would show when prompted. A new web part in this scenario can be easily added using a plus icon inside of your SharePoint interface – in our example, it’ll be the File Viewer object type that’ll allow us to showcase our newly uploaded Excel dashboard.
It’s not the only way to paste your Excel document as a SharePoint reporting dashboard, either. This next approach takes advantage of SharePoint’s ability to embed information as a part of its web pages and gives more room to customize visualization of your dashboard. Both classic and modern SharePoint pages offer the ability to embed various information into your SharePoint web site using Embed web part. In this case, we’ll be using an Excel Online workbook to try and turn it into an actual SharePoint reporting dashboard.
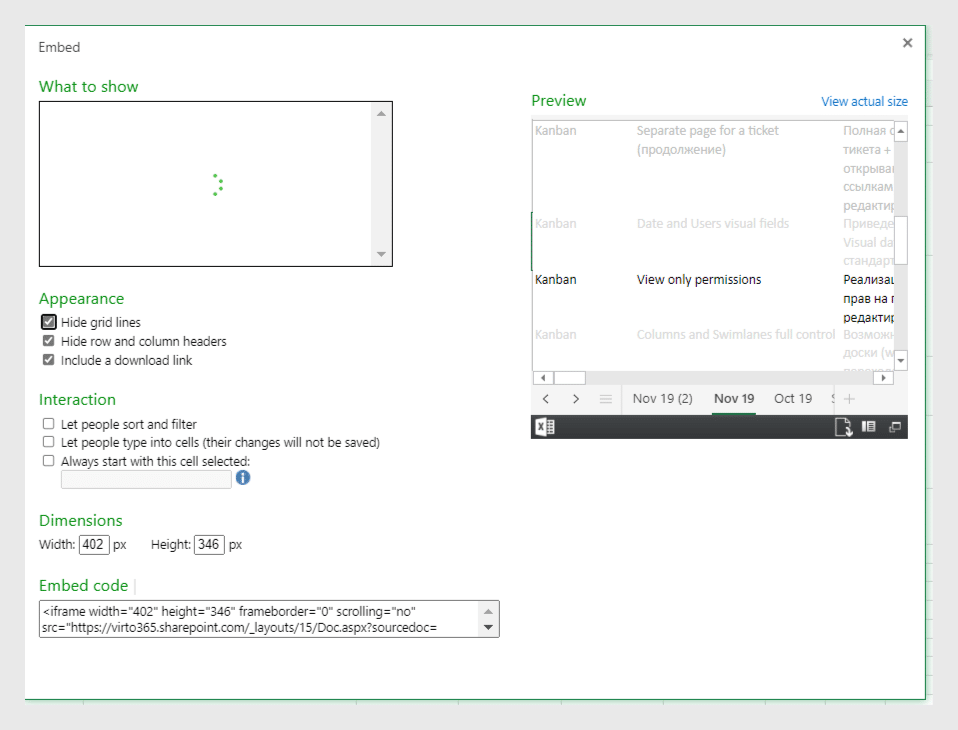
Excel Online makes it easy to generate code for embedding your information in the first place. To generate such a code, you’ll have to go to “File - Share - Embed” in Excel Online. After that, you should see a new window open up inside your Excel Online session that lets you customize what exactly you want to be shown as embedded information, and the code that you can copy.
After you’re done copying the embed code of your Excel Online dashboard, it’s time to turn it into a SharePoint reporting dashboard. We can do that in both SharePoint on-premise, as well as with classic SharePoint Online web pages. This approach should work in modern SharePoint pages, too, since both classic and modern pages have the ability to embed information as a part of themselves.
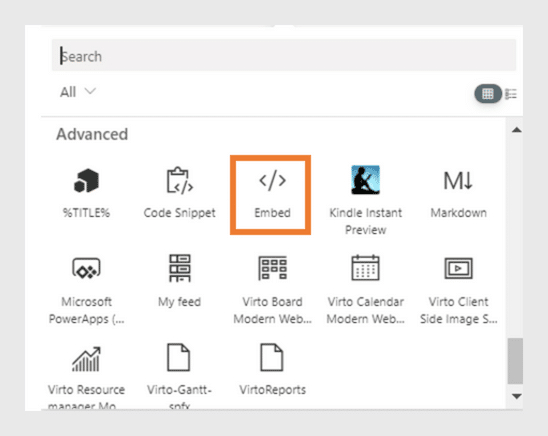
You can access the “Embed Code” menu with classic SharePoint web sites by going to “Insert - Embed Code” in the SharePoint menu. Alternatively, you can access the Embed web part in modern SharePoint web sites by using the “plus” sign under one of the parts in your SharePoint page in the “Edit” mode, and choosing “Embed” icon from the drop-down list.
Unfortunately, some of the more unusual tools are not included in the SharePoint package and require you to use one of the third-party charting tools. The market for such tools is highly extensive and varied, which is why we’re presenting you with a list of dashboards that we can personally recommend.
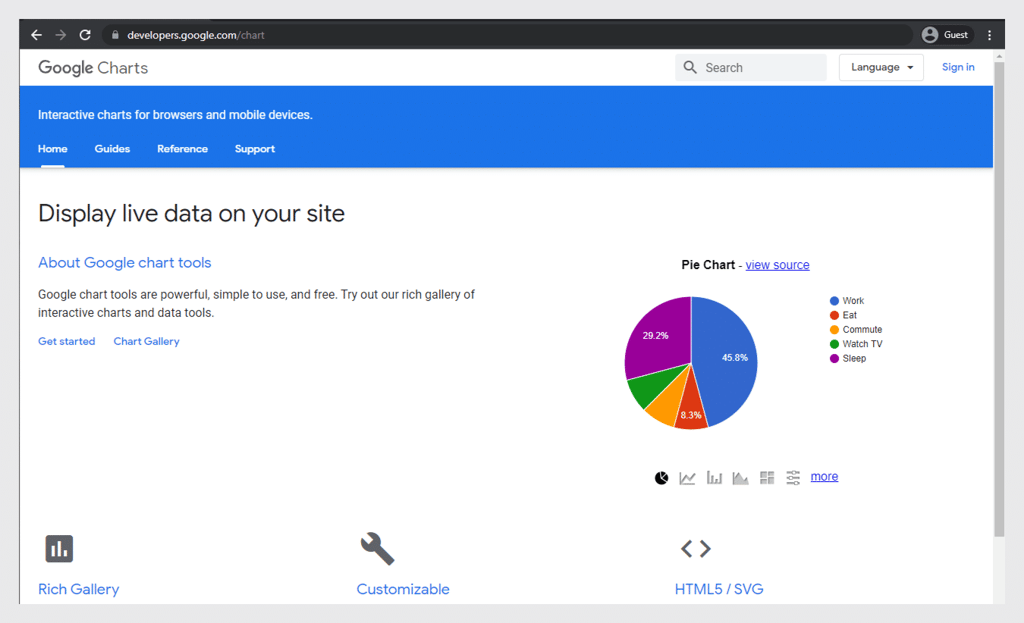
Google Chart is a rather powerful chart web part – which is why the fact that it’s free is so surprising. It is used quite a lot to generate visual reports from SharePoint lists, offering the ability to generate different chart types, so that you can create dashboard in SharePoint and fill it with various types of charts. The way it works is that all of the charts are HTML5-based, they require no plugins but do require you to integrate them into your dashboard’s code.
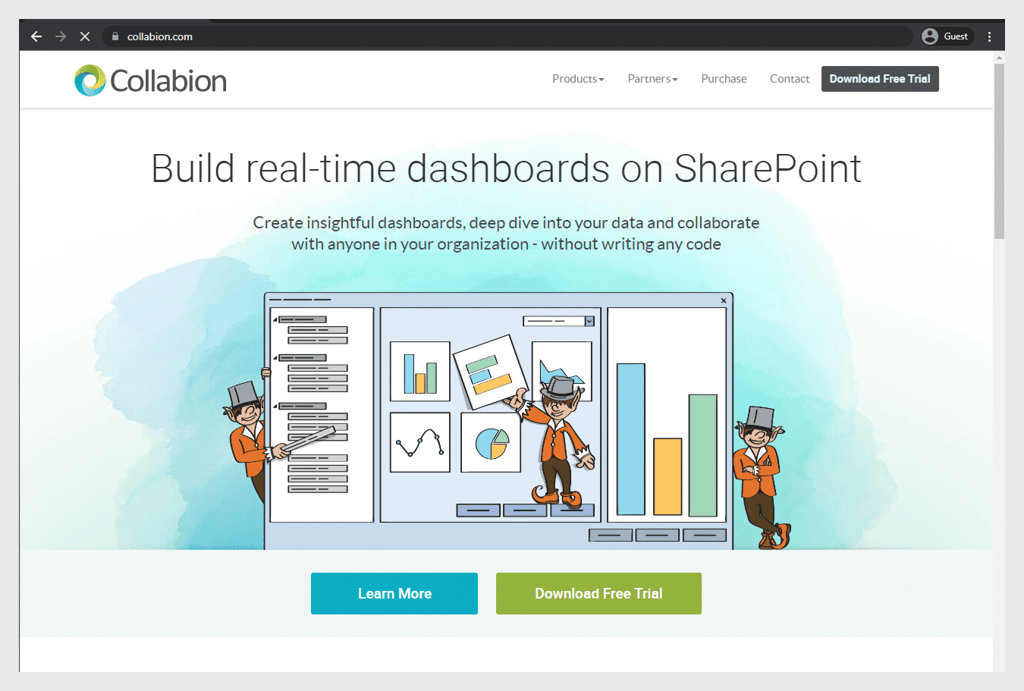
Collabion, on the other hand, is a tool that allows you to create entire dashboards with interactive elements based on your data from SharePoint lists. It supports multiple external sources of data and offers interactive elements, such as the ability to show aggregated information with the option to further elaborate on that specific part of a dashboard. You can also find several different SharePoint dashboard examples on their website. It works with all versions of SharePoint that can be deployed on-premise.
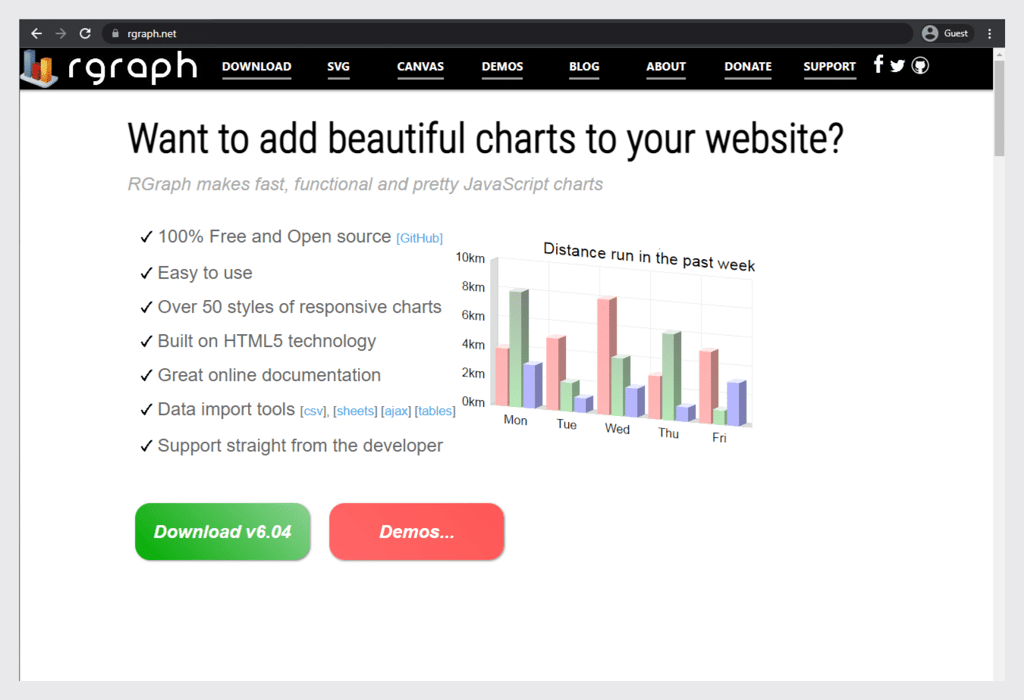
RGraph is a completely free way to generate charts for your SharePoint dashboard by combining your SharePoint data with this free and open-source library of SVG graphs and HTML5 canvases. It is completely free, offers more than fifty different types of charts, is capable of integrating into SharePoint dashboards, and is generally very versatile.
A rather unconventional participant of this list, Power Pivot is a data modeling technology created by Microsoft that allows users to generate complex inter-connected data models with various relationships and calculations. It can also use multiple different data sources and can create pivot tables with filters. While it has been declared deprecated for SharePoint 2016, it can still be added using Office Online Server and its particular part – SharePoint Server 2016.
Chart Web Part is a tool that was originally created to allow SharePoint users the ability to see various performance details at a glance. As such, Chart Web Part can be used to visualize information, share it with other Chart Web Parts, and connect external data with these web parts. Google also has its own gallery of charts with many SharePoint dashboard examples. While it cannot be used in SharePoint 2013 and 2016 by default, it can still be added using this particular name: Microsoft.Office.Server.WebControls.ChartWebPart.

Power BI is a relatively new invention of Microsoft that presents the ability to intuitively display information in an immersive way by utilizing highly interactive UI. There are also many different features that allow users to simplify complex pieces of information, as well as the support of hybrid architectures. It is available for mobile devices, desktops, and more – allowing you to create dashboard in SharePoint from any device.
Bamboo Solutions has also presented its own take on a chart creation tool that can work with data from both SharePoint lists and other sources. Settings configuration is also available at run time, which allows you to add more information to the source whenever necessary. It can also offer an export option into PDF and other file types, and it can develop custom code for you to integrate into your SharePoint dashboard.
iDashboards is a slightly different approach to data visualization software, since this one operates as a self-sufficient platform, and acts as a reliable and relatively cheap alternative to standalone chart and dashboard creators. As usual, it can work with multiple different sources, including SharePoint lists, and can export and convert reports based on aggregated data into PDF, Excel, or HTML format.
Microsoft’s Reporting Services via SSRS
SSRS is an SQL Server Reporting Service – a decent alternative to any other dashboard-related third-party solution, but this one is developed by Microsoft themselves and it does require an SQL Server license. Originally it is a reporting service feature that technically allows users to create a SharePoint dashboard from list, even if it needs to be customized further to be more readable.
The only step that is needed here is to create a dataset based on the data source that is a SharePoint list, and then use a report builder to connect and visualize the data in question. It can be used to create charts, interactive maps, tables, gauges, and more.
SharePoint Designer is Microsoft’s own tool that allows you to create a custom view of any SharePoint list, with the ability to filter information, change the order of sorting, show or hide columns, and more. You can change layouts via conditional formatting, connect a single view of a particular list with other similar views, and more. While this tool is not technically available in MS SharePoint 2016, its 2013 SP1 version can still be used with SharePoint 2016.
Conclusion
Of course, these are not the only options that users can choose from when it comes to creating dashboards and charts in SharePoint. There’s a broad variety of different tools and solutions that can help you with visualization, aggregation, and various calculations. The only thing you’ll have to do with all that information is to make the right decision for your company.