Gantt charts are powerful visual tools that have revolutionized project management since their inception in the early 20th century. Named after their creator, Henry Gantt, these charts provide a graphical representation of a project timeline, displaying tasks, dependencies, and progress at a glance.
Originally hand-drawn on paper, Gantt charts have evolved with technology, now often created and managed using sophisticated software. Despite this evolution, their core purpose remains unchanged: to help project managers and teams plan, schedule, and track projects efficiently.
In modern project management, Gantt charts continue to be indispensable for several reasons. They offer a clear visual overview of project timelines, allow for easy identification of task dependencies, and help in resource allocation. Moreover, they serve as effective communication tools, enabling stakeholders to quickly grasp project status and potential bottlenecks.
This article will guide you through the world of Gantt charts, covering:
- A detailed explanation of what Gantt charts are and their components
- The benefits and limitations of using Gantt charts in project management
- Step-by-step instructions on how to create a Gantt chart
- Best practices for implementing Gantt charts in real projects
- Tools and software available for creating and managing Gantt charts
What Is a Gantt Chart?
A Gantt chart is a visual project management tool that illustrates a project schedule over time. It consists of horizontal bars representing tasks or activities, arranged on a timeline. Each bar’s length corresponds to the duration of the task, while its position shows the start and end dates. This graphical representation allows project managers and team members to quickly grasp the project’s timeline, task dependencies, and overall progress at a glance.
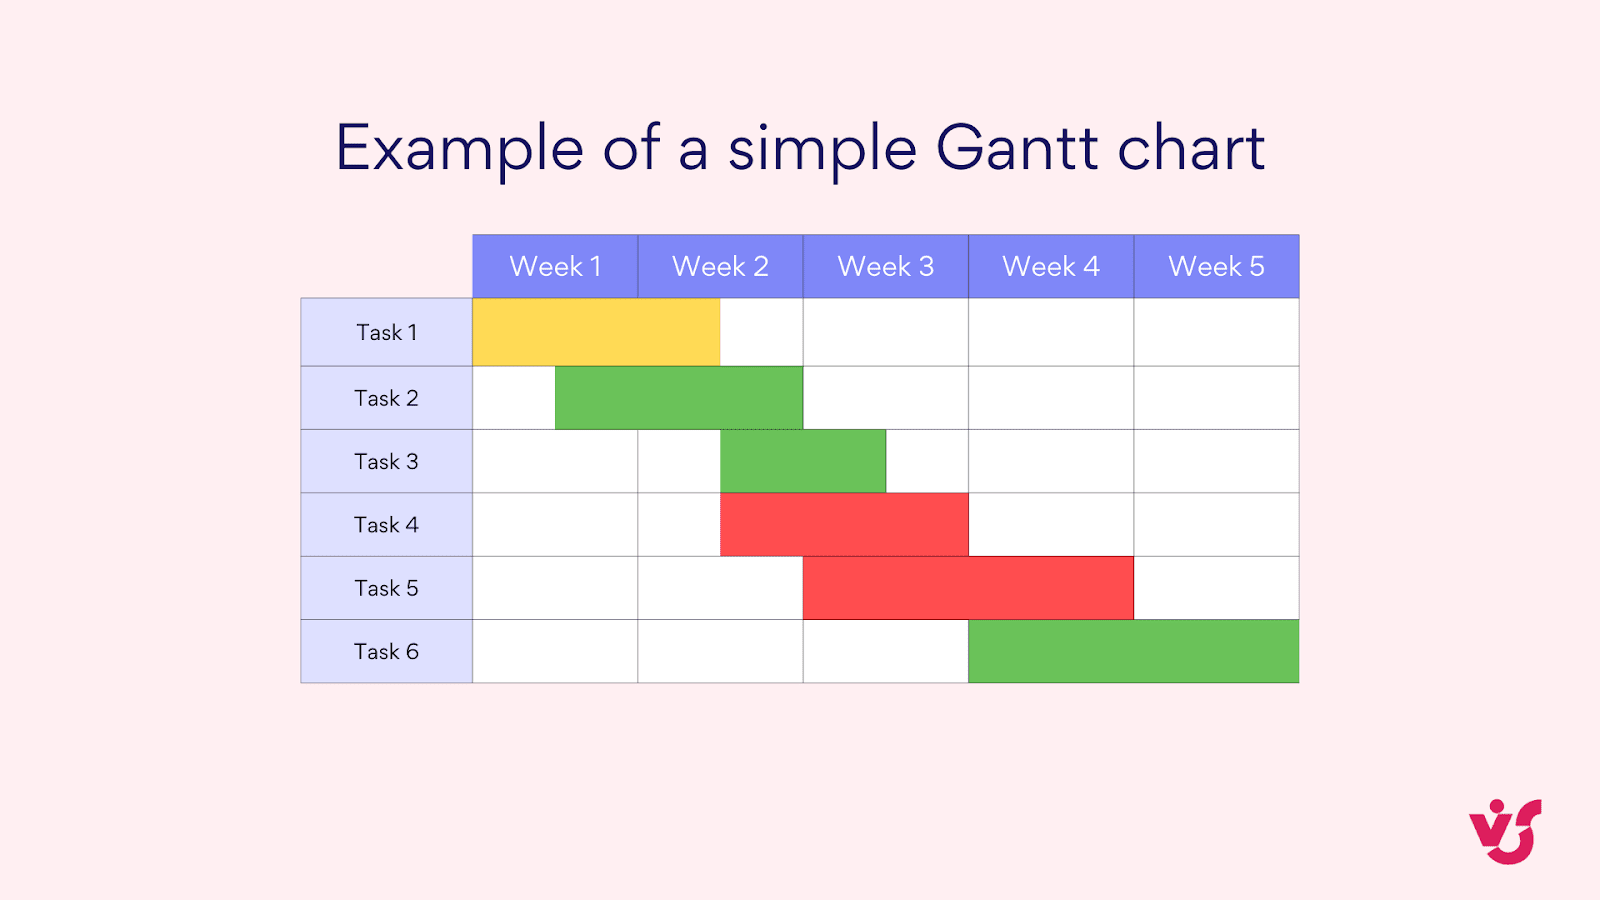
Pic. 1. Example of a simple Gantt chart.
Gantt charts display the following key elements:
- Tasks: Listed vertically on the left side of the chart.
- Timeline: Shown horizontally across the top, typically in days, weeks, or months.
- Bars: Representing the duration and schedule of each task.
- Milestones: Important events or deadlines within the project.
- Dependencies: Connections between tasks that indicate their relationships.
Unlike other project planning tools such as Kanban boards, which focus on workflow and task status, Gantt charts excel at visualizing the chronological sequence of tasks and their interdependencies. While Kanban boards are great for managing ongoing processes and visualizing work in progress, Gantt charts are particularly useful for projects with defined start and end dates, multiple interconnected tasks, and specific timelines.
👉 For a detailed comparison between Gantt charts and Kanban boards, you can refer to this comprehensive article: Gantt Chart vs Kanban Board
What is a project Gantt chart: What is a Gantt chart in project management?
A project Gantt chart is a specific application of the Gantt chart format to project management. It provides a visual timeline of a project’s tasks, milestones, and dependencies, allowing project managers to:
- Plan and schedule tasks;
- Allocate resources effectively;
- Track progress against the planned timeline;
- Identify potential bottlenecks or scheduling conflicts;
- Communicate project status to stakeholders.
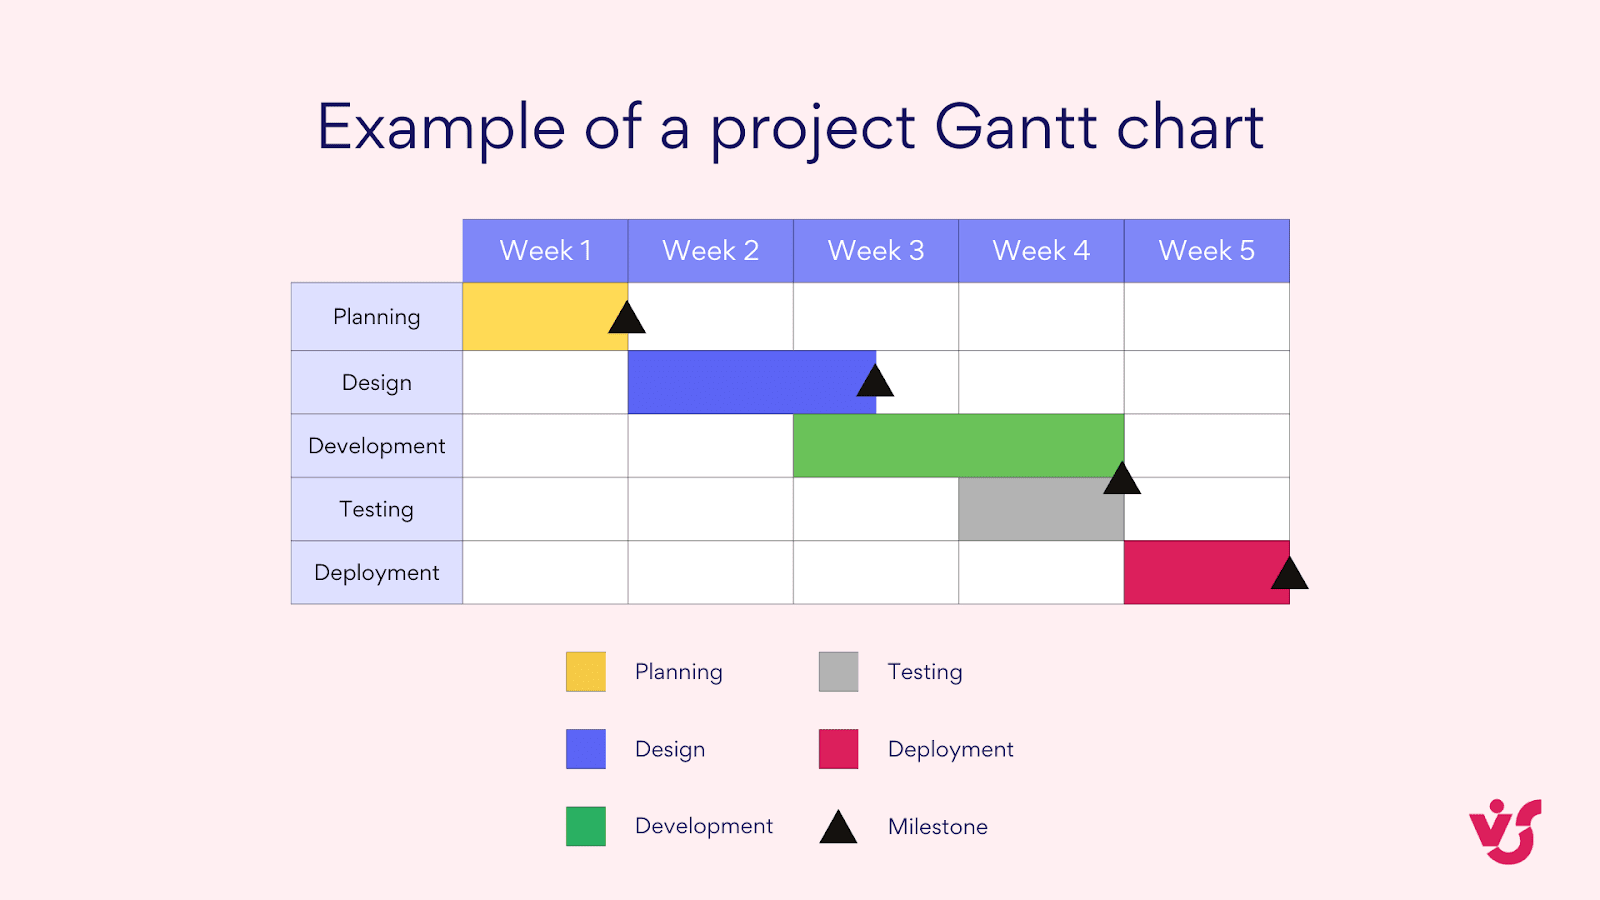
Pic. 2. Example of a project Gantt chart.
Project Gantt charts are particularly valuable for complex projects with multiple interconnected tasks and resources. They help ensure that all team members understand their responsibilities and deadlines, while also providing a big-picture view of the project’s progress and timeline. By using a project Gantt chart, managers can more easily adjust schedules, reallocate resources, and keep projects on track toward successful completion.
Project management Gantt chart: The role of a Gantt chart in project management
Gantt charts play a crucial role in project management, serving as a visual backbone for planning, executing, and monitoring projects. They offer project managers a powerful tool to oversee various aspects of project execution:
- Tracking progress: Gantt charts provide an at-a-glance view of project progress. As tasks are completed, the corresponding bars on the chart can be filled or colored differently, allowing project managers to quickly assess which tasks are on schedule, behind, or ahead. This visual representation makes it easy to identify potential bottlenecks or delays that might impact the overall project timeline.
- Managing resources: By displaying tasks over time, Gantt charts help project managers allocate resources effectively. They can see when specific team members or equipment will be needed, allowing for better planning and preventing overallocation. This visibility helps in balancing workloads and ensuring that resources are available when required.
- Assigning tasks: Gantt charts facilitate clear task assignment. Each bar on the chart can be associated with a team member or department, making responsibilities explicit. This clarity helps prevent confusion about who is responsible for what, and when each task needs to be completed.
Types of Gantt charts
Gantt charts come in various forms, each tailored to meet specific project management needs. While all Gantt charts share the core feature of visualizing tasks over time, different types offer unique capabilities to address various project complexities and management styles.
- Basic Gantt charts: These show tasks and their durations without dependencies. They’re ideal for simple projects or when you want a quick overview of task timelines.
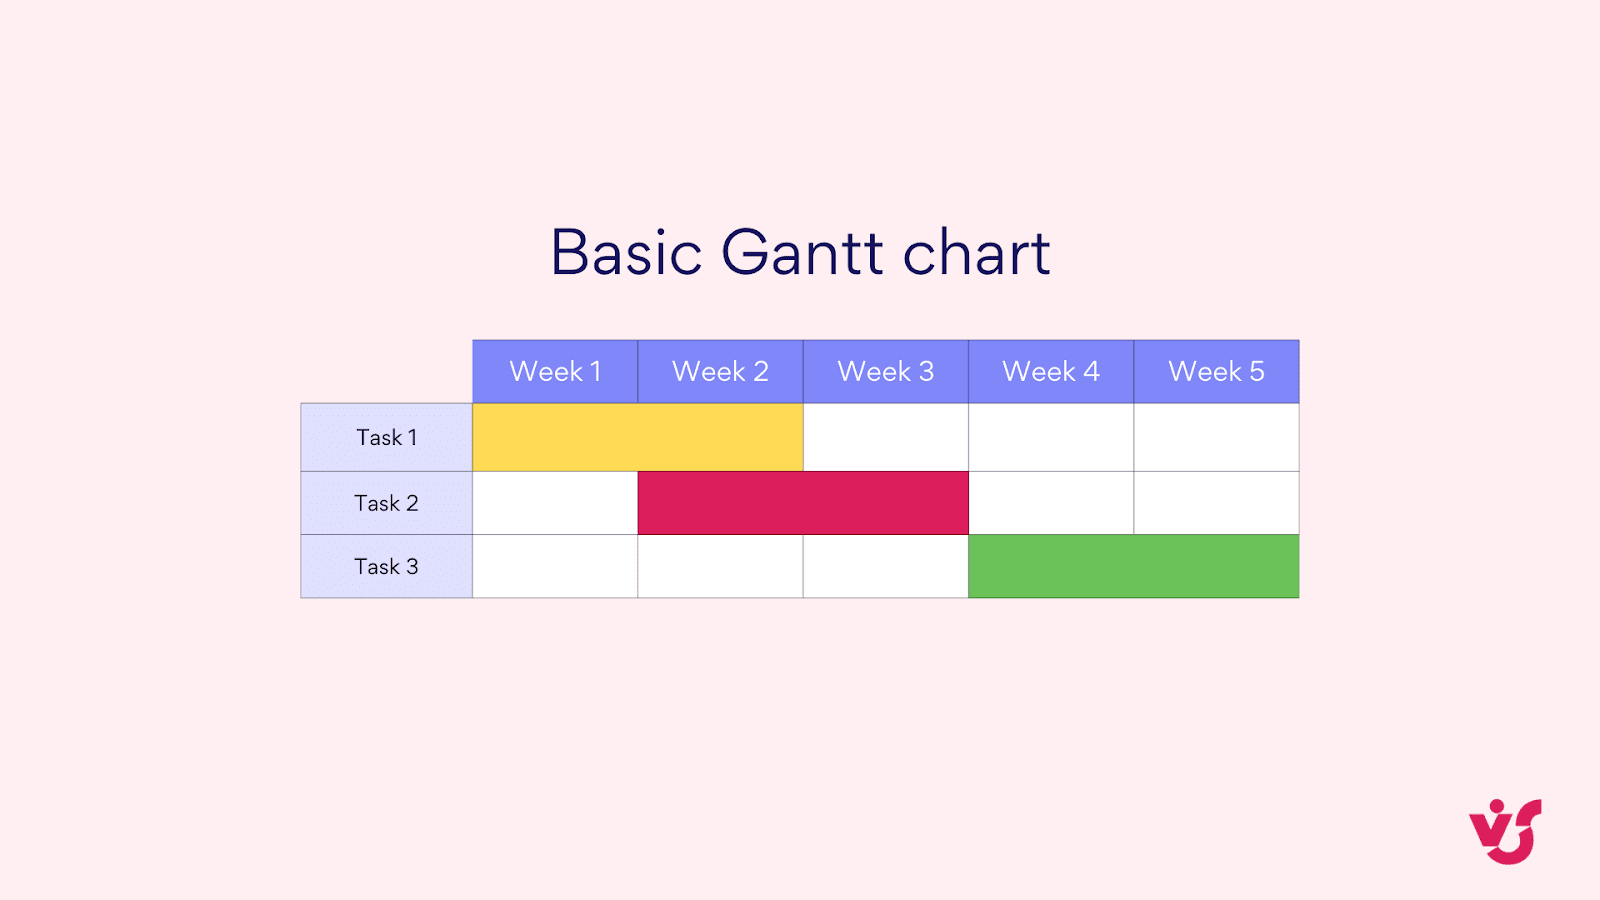
Pic. 3. Basic Gantt chart.
- Dependency Gantt charts: These include arrows or lines showing how tasks are related (e.g., Task B can’t start until Task A is finished). They’re crucial for complex projects where task order is critical.
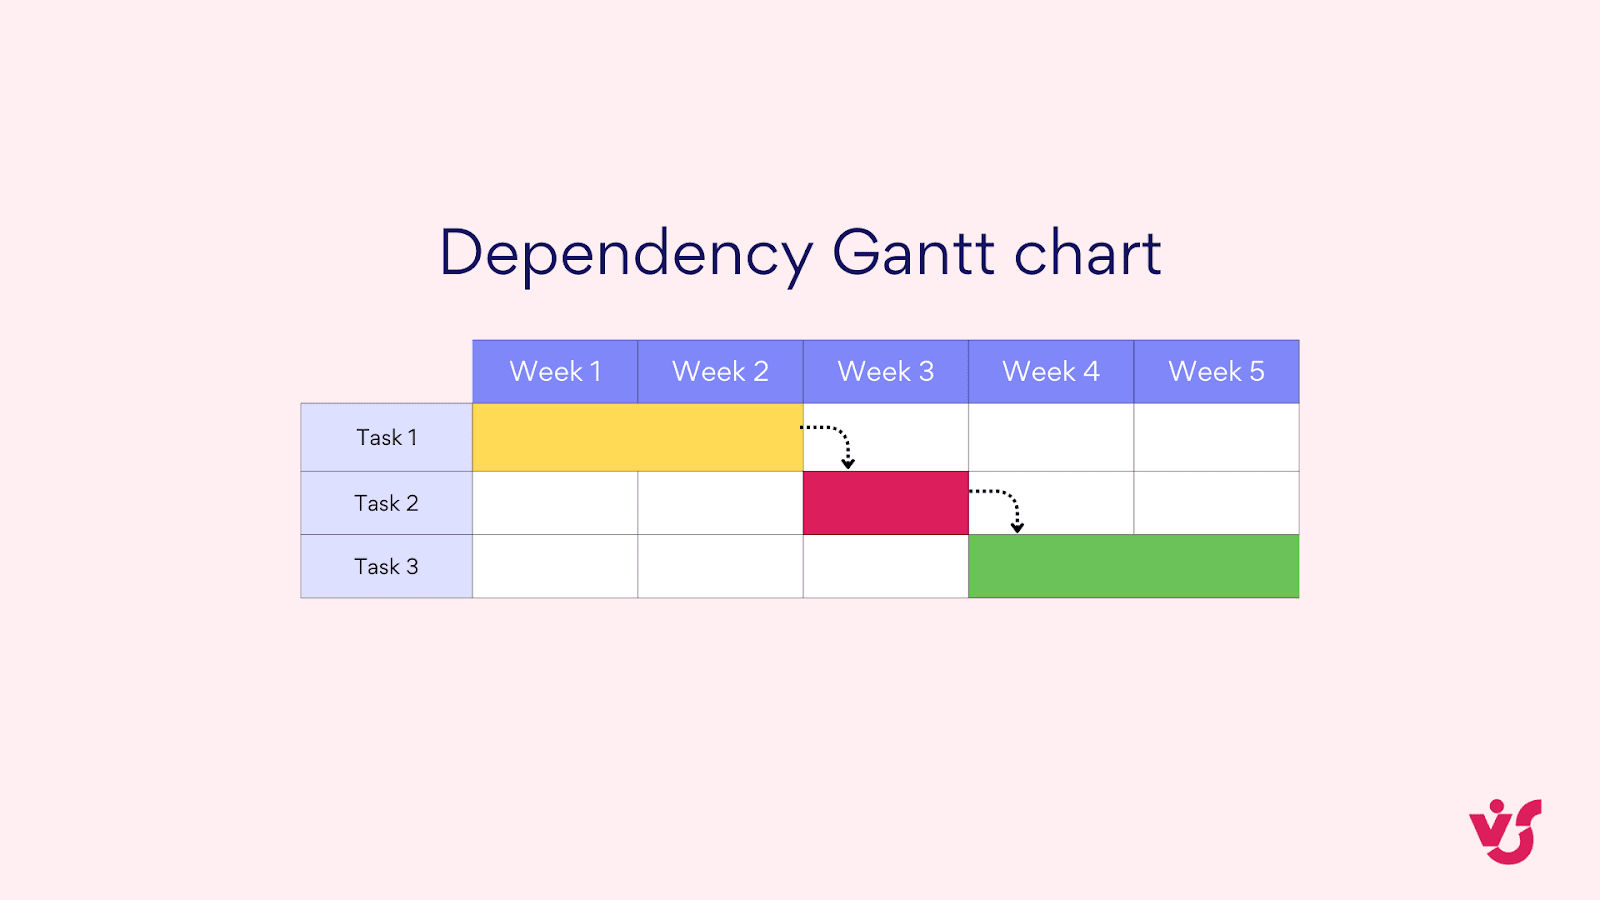
Pic. 4. Dependency Gantt chart.
- Resource-loaded Gantt charts: These show not just tasks and timelines, but also the resources (people, equipment) assigned to each task. They’re excellent for resource management in larger projects.
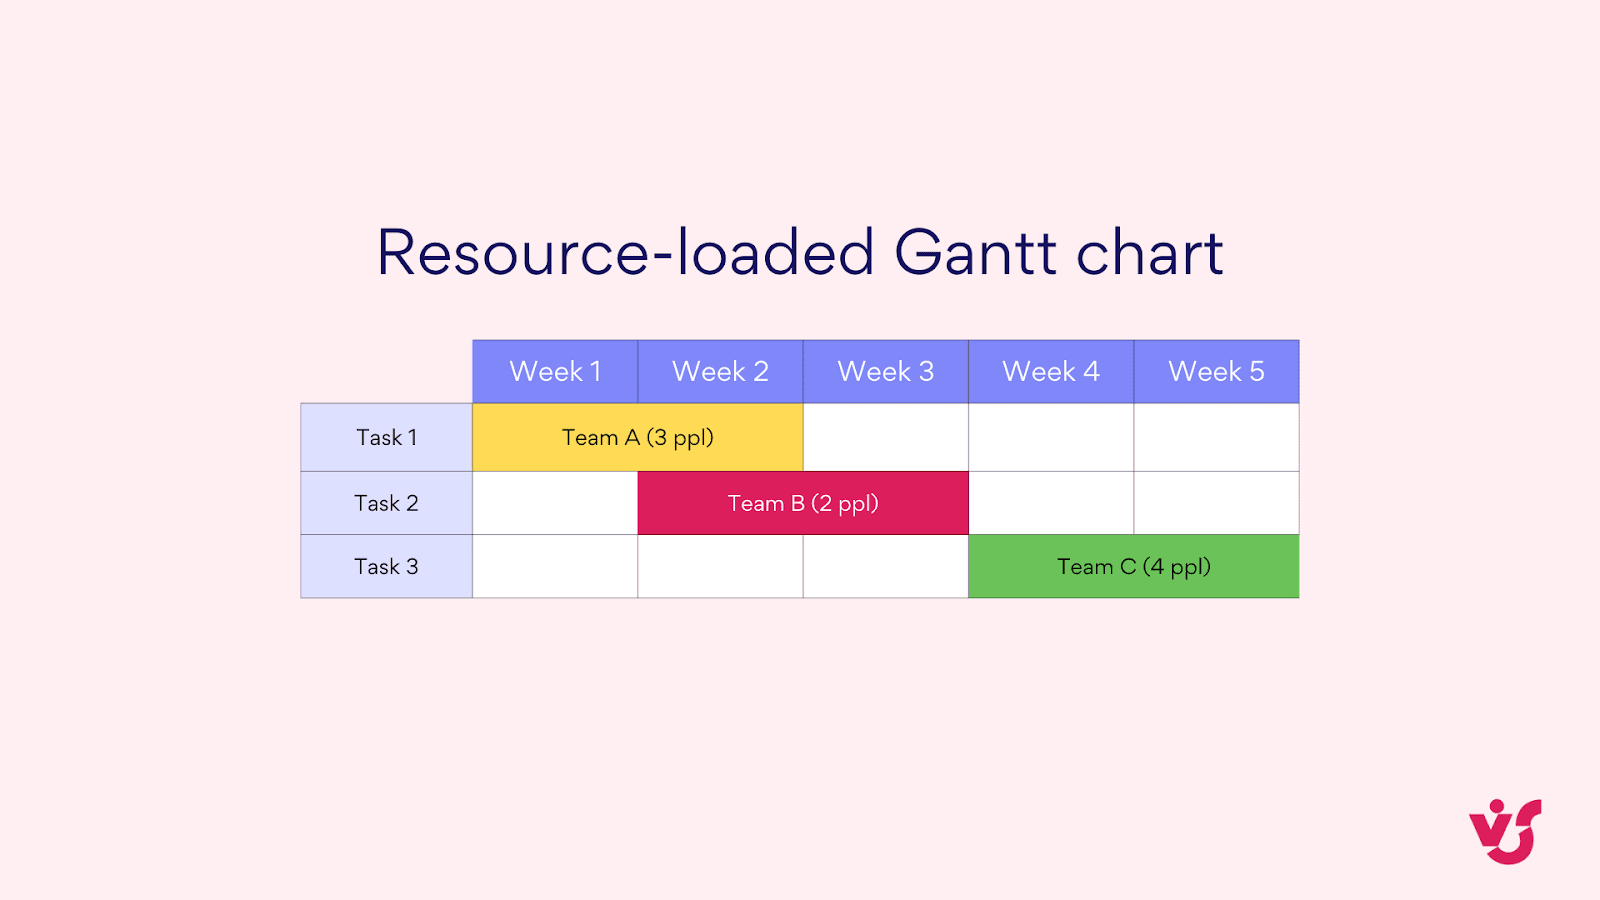
Pic. 5. Resource-loaded Gantt chart.
- Milestone Gantt charts: These highlight key events or deadlines within the project. They’re useful for high-level project overviews and stakeholder communication.
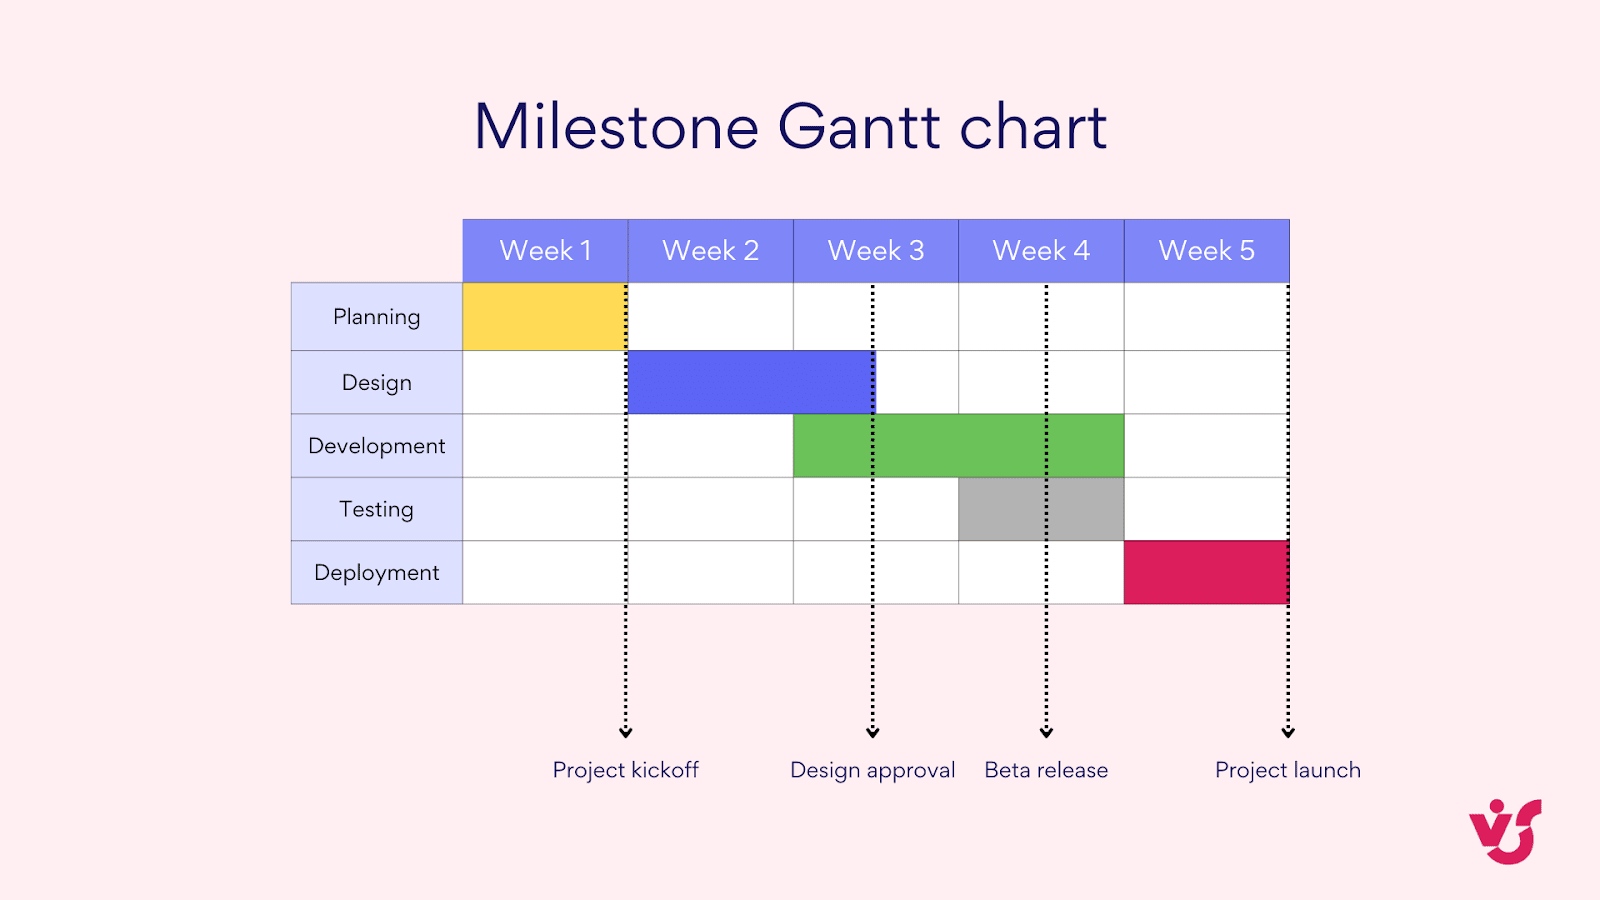
Pic. 6. Milestone Gantt chart project management.
- Floating task Gantt charts: These include tasks without fixed start dates, which can be moved around based on resource availability or other constraints. They’re helpful in agile environments or projects with flexible timelines.
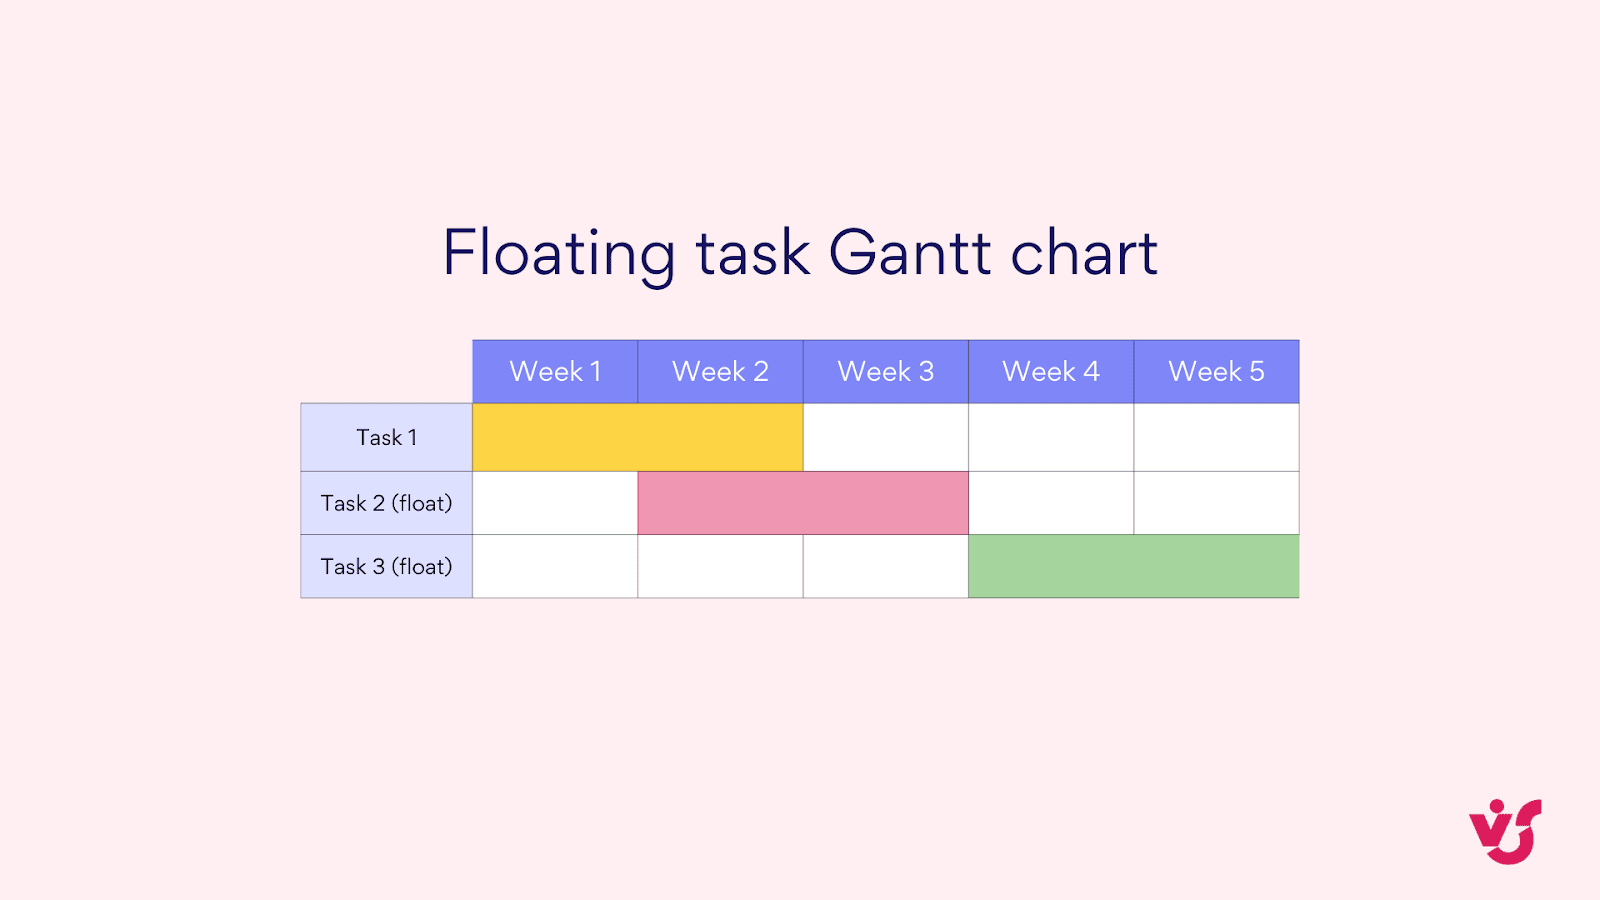
Pic. 7. Floating task Gantt chart.
The choice of Gantt chart type depends on the project’s complexity, the level of detail required, and the specific aspects of the project you need to focus on.
👉What is a project planning Gantt chart? A project planning Gantt chart is a visual representation of a project’s tasks, timeline, and dependencies, used during the initial stages of project development. It serves as a roadmap for the entire project, helping managers and team members visualize the project’s scope, duration, and sequence of activities. A project schedule Gantt chart, on the other hand, is a more detailed version of the planning Gantt chart, focusing on the specific timing and sequence of tasks throughout the project’s lifecycle. It provides a comprehensive view of when each task is set to begin and end, clearly displaying the project’s critical path and any potential scheduling conflicts.
Why use a Gantt chart
Gantt charts have become an indispensable tool in project management for several compelling reasons:
- Visual representation of project timeline: Gantt charts transform complex project schedules into easy-to-understand visual timelines. This visual format allows stakeholders at all levels to quickly grasp the project’s scope, timeline, and current status without needing to wade through detailed reports or spreadsheets.
- Task organization and sequencing: By laying out tasks chronologically, Gantt charts help in logically organizing and sequencing project activities. This organization helps identify critical paths, potential conflicts, and opportunities for parallel work, leading to more efficient project execution.
- Clear deadline visualization: One of the most valuable aspects of Gantt charts is their clear representation of task and project deadlines. The timeline format makes it immediately apparent when each task is due and how it relates to the overall project deadline. This visibility helps keep team members focused and accountable.
- Improved communication: Gantt charts serve as a universal language for project teams. They provide a common reference point for discussions about project status, resource allocation, and potential issues. This shared visual tool can significantly enhance communication among team members, stakeholders, and clients.
- Flexibility and adaptability: Modern digital Gantt charts allow for easy updates and modifications as project circumstances change. This flexibility enables project managers to adapt quickly to new developments, shifting priorities, or unexpected challenges.
👉 So, what is a Gantt chart and what is its purpose? A Gantt chart is a horizontal bar chart used in project management to illustrate a project schedule. Named after its creator, Henry Gantt, it provides a graphical representation of a project’s tasks, their durations, and their dependencies over time. The primary purposes of a Gantt chart are schedule visualization, task management, resource allocation, and progress tracking, to name just a few.
👉 What is a project timeline Gantt chart? A project timeline Gantt chart is a high-level visual representation of a project’s major phases, milestones, and deliverables over its entire duration. It provides a bird’s-eye view of the project, making it particularly useful for communicating the project’s overall progress and key events to stakeholders who may not need the granular details of a full schedule Gantt chart.
How to Create a Gantt Chart for a Project?
Creating a Gantt chart may seem daunting at first, but with a systematic approach, it becomes a straightforward and invaluable process for project management. This section will guide you through the step-by-step process of creating a Gantt chart, from initial task identification to final review and refinement. We’ll also address common questions about Gantt chart creation, ensuring you have all the tools you need to visualize your project timeline effectively.
Step-by-step guide to creating a Gantt chart
Follow these steps to build a comprehensive Gantt chart for your project:
- List all project tasks:
- Brainstorm and document all tasks required to complete the project.
- Break down larger tasks into smaller, manageable subtasks.
- Ensure each task has a clear, measurable outcome.
- Determine task dependencies:
- Identify which tasks must be completed before others can start.
- Note any tasks that can be performed simultaneously.
- This will help you understand the project’s critical path.
- Estimate task durations:
- Consult with team members or use historical data to estimate how long each task will take.
- Be realistic and include some buffer time for unexpected delays.
- Assign resources:
- Determine who will be responsible for each task.
- Consider the availability and skills of your team members.
- Ensure no resource is overallocated across multiple tasks.
- Set start and end dates:
- Based on task durations and dependencies, establish start and end dates for each task.
- Consider any fixed deadlines or milestones that need to be met.
- Create the chart structure:
- Draw a horizontal timeline across the top of your chart, broken into appropriate time units (days, weeks, or months).
- List tasks vertically on the left side of the chart.
- Plot tasks as horizontal bars:
- For each task, draw a horizontal bar from its start date to its end date.
- The length of the bar should correspond to the task’s duration.
- Indicate dependencies:
- Draw arrows between tasks to show dependencies.
- This visually represents the flow of work in your project.
- Highlight milestones:
- Mark important project milestones with a distinct symbol (often a diamond shape).
- These could include key deliverables, review points, or significant events.
- Add resource information:
- If using a resource-loaded Gantt chart, add resource names or team assignments to each task bar.
- Review and refine:
- Step back and review your chart for logic and completeness.
- Adjust as necessary to ensure it accurately represents your project plan.
- Update regularly:
- As your project progresses, update your Gantt chart to reflect actual progress and any changes in the plan.
How to make a Gantt chart for a project?
To make a Gantt chart for your project, follow these key steps:
- Use a tool: Choose a Gantt chart software (like Microsoft Project, TeamGantt, or even Excel) or draw it manually on paper for simple projects.
- Define project scope: Clearly outline what the project aims to achieve.
- Break down the work: Divide the project into main tasks and subtasks.
- Sequence the tasks: Determine the order in which tasks need to be completed.
- Estimate durations: Assign realistic timeframes to each task.
- Set milestones: Identify key points in the project timeline.
- Assign resources: Determine who will be responsible for each task.
- Create the chart: Input all the information into your chosen tool or draw it out.
- Review and adjust: Ensure the chart accurately represents your project plan and make any necessary adjustments.
- Share with stakeholders: Present the Gantt chart to your team and stakeholders for feedback and approval.
Remember, a Gantt chart is a living document. As your project progresses, regularly update the chart to reflect actual progress and any changes in the project plan. This will help you stay on top of your project’s timeline and quickly identify any potential delays or issues.
👉A Gantt chart is the same as a project management plan? While a Gantt chart is a crucial component of project management, it is not synonymous with a comprehensive project management plan. A Gantt chart primarily focuses on the visual representation of tasks, timelines, and dependencies, serving as a scheduling and progress-tracking tool. In contrast, a project management plan is a much broader document that encompasses various aspects of the project beyond just the schedule.
What makes a good Gantt chart?
A well-crafted Gantt chart is more than just a pretty timeline – it’s a powerful tool that provides clarity, facilitates communication, and drives project success. Let’s explore the key elements that distinguish an effective Gantt chart:
- Realistic deadlines. A good Gantt chart reflects attainable timelines. It’s crucial to:
- Consult with team members to estimate task durations accurately.
- Include buffer time for unexpected delays.
- Regularly update deadlines based on actual progress.
Realistic deadlines prevent team burnout and maintain project credibility with stakeholders.
- Clear task dependencies. Visibility into task relationships is vital. An effective Gantt chart should:
- Clearly show which tasks depend on others.
- Use arrows or lines to visually connect related tasks.
- Highlight the critical path of the project.
Understanding these relationships helps in identifying potential bottlenecks and managing project flow.
- Progress monitoring capabilities. The ability to track progress at a glance is a hallmark of a good Gantt chart. This includes:
- Visual indicators of completed tasks (e.g., filled bars).
- Percentage completion for ongoing tasks.
- Comparison of planned vs. actual timelines.
These features enable quick identification of delays or ahead-of-schedule tasks.
- Resource allocation. A comprehensive Gantt chart should display:
- Who is responsible for each task.
- When resources are engaged and for how long.
- Potential resource conflicts or overallocation.
This information aids in balancing workloads and ensuring efficient use of team capacity.
- Milestones and key dates. Highlighting significant points in the project timeline helps maintain focus:
- Clearly marked milestones (often with diamond shapes).
- Important deadlines or review dates.
- Project start and end dates.
These markers provide a quick overview of major project phases and deliverables.
- Appropriate level of detail. A good Gantt chart strikes a balance between:
- Providing enough detail for effective management.
- Avoiding clutter that can obscure the big picture.
The level of detail may vary based on the audience—more granular for the project team, more high-level for executives.
- Visual clarity. Effective Gantt charts use visual elements wisely:
- Color coding for different types of tasks or teams.
- Consistent and intuitive symbols.
- Clear, readable labels and dates.
Good visual design enhances understanding and reduces the cognitive load on viewers.
- Flexibility and ease of updates. As projects evolve, so should the Gantt chart. A good chart is:
- Easy to update as circumstances change.
- Capable of quickly showing the impact of delays or changes.
- Accessible to team members for collaborative updates.
👉 So, how do you make a good Gantt chart for a project? Creating an effective Gantt chart for your project begins with a clear understanding of your project’s scope and a well-defined work breakdown structure. Once you have this foundation, choose appropriate software that suits your project’s complexity. Then, start by listing all tasks and subtasks in chronological order and set realistic timelines for each. As you build your chart, clearly identify and indicate task dependencies to visualize the project’s critical path. Assign resources, whether they’re specific team members or entire departments, to each task. Don’t forget to highlight key milestones that mark significant project phases or deliverables—these serve as important checkpoints in your project timeline. To enhance the visual appeal and clarity of your chart, use color coding to distinguish between different types of tasks or to show progress. Always include a legend that explains any symbols or color coding you’ve used, making the chart easy for anyone to interpret.
How to Use a Gantt Chart for Project Management?
In this section, we’ll dive into the practical applications of Gantt charts throughout the project lifecycle, from initial planning to final execution.
Practical use of a Gantt chart in project planning
Gantt charts are powerful visual tools that can significantly enhance your project management capabilities. Let’s explore how to leverage Gantt charts effectively throughout the project lifecycle.
- Scheduling tasks and tracking progress
At the outset of your project, use your Gantt chart to lay out all tasks in chronological order. As you input each task, consider its duration, dependencies, and the resources required. This process often reveals potential bottlenecks or resource conflicts early on, allowing you to adjust your plan proactively.
Once your project is underway, update your Gantt chart regularly to reflect actual progress. Most Gantt chart software allows you to indicate the percentage of completion for each task. This visual representation makes it easy to spot tasks that are falling behind schedule or racing ahead of projections.
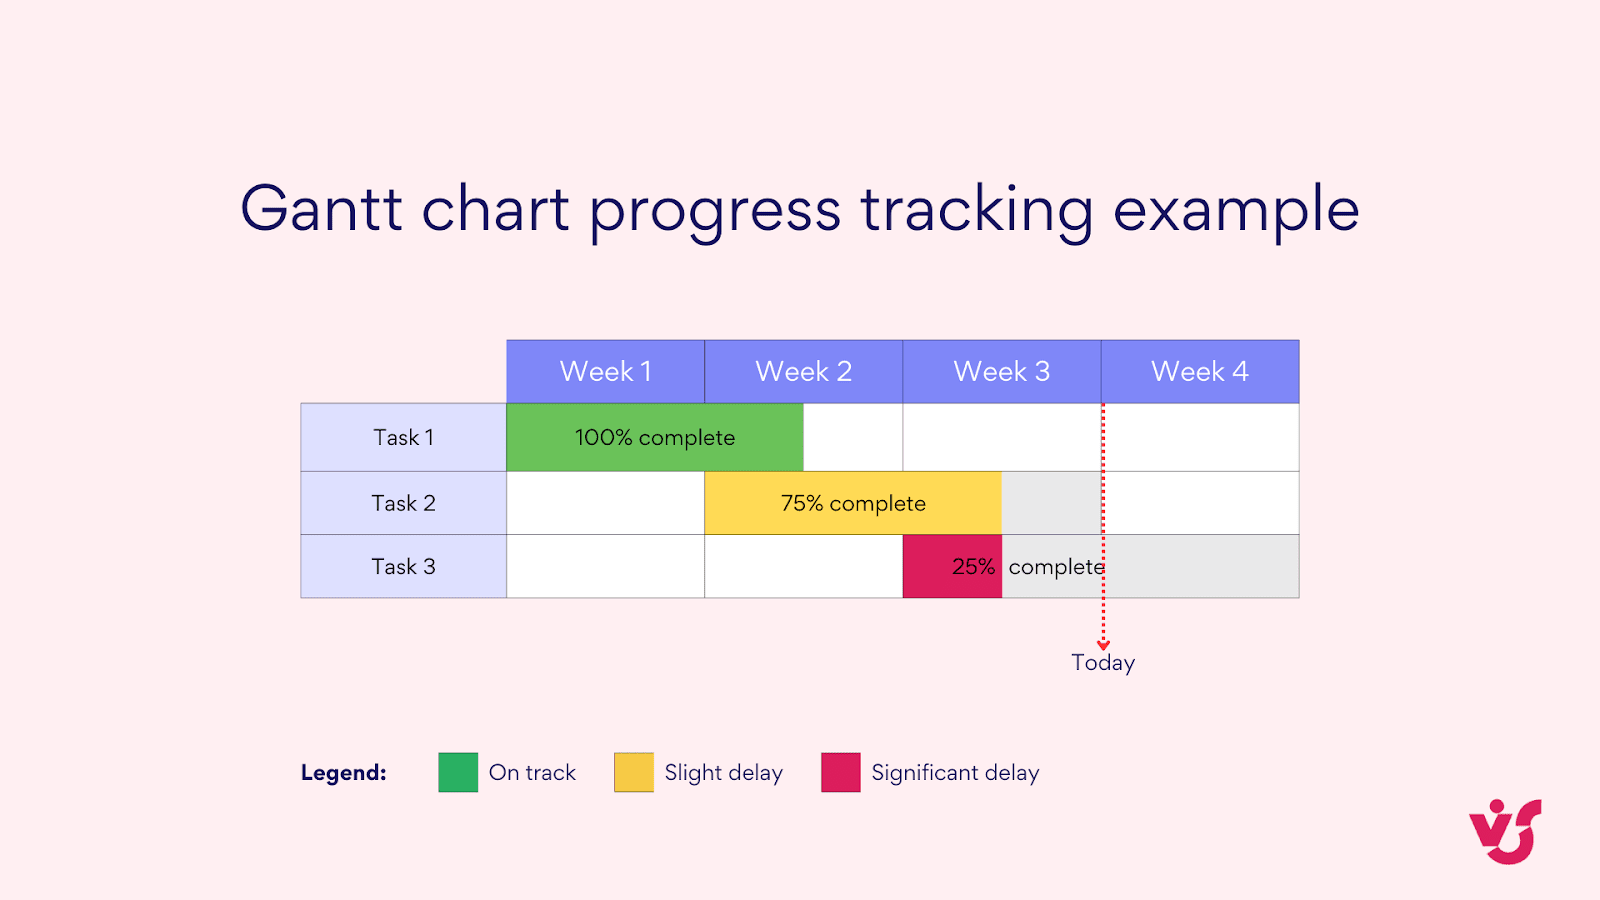
Pic. 8. Gantt chart progress tracking example.
- Making changes as the project progresses
As your project evolves, you’ll inevitably need to make changes to your original plan. Gantt charts excel at visualizing the impact of these changes. When you adjust a task’s duration or start date, modern Gantt chart software will automatically update all dependent tasks, giving you an immediate view of how the change affects your overall timeline.
- Integration with other project management tools
To maximize the effectiveness of your Gantt chart, integrate it with other project management tools. Many Gantt chart applications can sync with task tracking systems, allowing team members to update their progress directly. This integration ensures your Gantt chart always reflects the most current project status.
Risk management tools can also be linked to your Gantt chart. By associating risks with specific tasks or milestones, you can visualize potential trouble spots in your timeline. Some advanced Gantt chart software even allows for scenario planning, where you can model the impact of different risk events on your project schedule.
- Adapting Gantt charts for agile methodologies
While Gantt charts are traditionally associated with waterfall project management, they can be adapted for use in agile methodologies like Scrum and Kanban. In an agile context, use your Gantt chart to:
- Plan and visualize sprints or iterations.
- Track epic-level progress across multiple sprints.
- Manage dependencies between different agile teams.
- Visualize the overall product roadmap.
For Kanban, you might use a Gantt chart to plan and track larger initiatives while using a Kanban board for day-to-day task management.
👉 To learn more about agile project management, consider reading Agile Kanban: Best Practices and Tools for Project Management.
5. Managing project changes and their impact
When changes occur, your Gantt chart becomes an invaluable tool for impact analysis. Here’s how to use it effectively:
- Identify the change and the tasks it affects directly.
- Adjust those tasks in your Gantt chart.
- Observe how the changes ripple through dependent tasks.
- Look for new bottlenecks or resource conflicts created by the change.
- Adjust other tasks as necessary to accommodate the change.
- Communicate the updated timeline to stakeholders, using the Gantt chart as a visual aid.
6. Analyzing deviations and taking action
Regular analysis of your Gantt chart can help you spot and address deviations from the plan. Here’s a systematic approach:
- Compare actual progress to planned progress for each task.
- Identify tasks that are significantly behind or ahead of schedule.
- For delayed tasks, determine the cause of the delay. Is it a resource issue? An unexpected complication? External factors?
- For tasks ahead of schedule, consider if resources can be reallocated to help with delayed tasks.
- Update your risk register based on your findings.
- Develop action plans for getting delayed tasks back on track.
- If necessary, revise future task estimates based on what you’ve learned.
Remember, the goal isn’t to stick rigidly to the original plan, but to use the Gantt chart as a tool for informed decision-making and proactive project management.
👉 How to use a Gantt chart to plan a project? First, list all tasks and subtasks, then estimate their durations. Identify task dependencies before inputting everything into your Gantt chart software. Assign resources, add milestones, and review the chart for bottlenecks or unrealistic timelines. Adjust as needed.
Benefits of using Gantt charts
Now, let’s explore the main advantages of incorporating Gantt charts into your project management toolkit.
- Clarity of planning
One of the primary benefits of Gantt charts is their ability to provide a clear, visual representation of your project timeline. This visual clarity offers several advantages:
- Big picture view: Gantt charts allow stakeholders to see the entire project at a glance, making it easier to understand the project’s scope and timeline.
- Task relationships: The visual format clearly shows how tasks relate to each other, highlighting dependencies and parallel activities.
- Resource allocation: By displaying which tasks are assigned to specific team members or departments, Gantt charts help in understanding and optimizing resource allocation.
- Milestone tracking: Important project milestones are easily identifiable, helping teams stay focused on key objectives.
2. Control over deadlines
Gantt charts provide robust mechanisms for deadline management:
- Visual seadlines: By representing tasks as bars on a timeline, Gantt charts make it immediately apparent when each task is due.
- Early warning system: As you update progress, it becomes clear which tasks are at risk of missing their deadlines, allowing for proactive management.
- Impact assessment: When deadlines shift, Gantt charts help visualize the ripple effect on subsequent tasks and the overall project timeline.
- Realistic scheduling: The process of creating a Gantt chart often leads to more realistic deadline setting, as it forces a detailed consideration of task durations and dependencies.
3. Management of Interdependent Tasks
One of the most powerful features of Gantt charts is their ability to manage task dependencies:
- Dependency visualization: Arrows or lines connecting tasks clearly show which tasks rely on the completion of others.
- Critical path identification: Gantt charts help in identifying the critical path of a project—the sequence of dependent tasks that determines the minimum time to completion.
- Bottleneck detection: By visualizing task dependencies, Gantt charts make it easier to spot potential bottlenecks in the project workflow.
- Efficient sequencing: The process of mapping dependencies in a Gantt chart often leads to more efficient task sequencing and resource allocation.
Situations where Gantt charts excel
While Gantt charts are versatile tools, they are particularly valuable in certain scenarios:
- Large IT projects: In complex software development or system implementation projects, Gantt charts help manage multiple workstreams, coordinate different teams, and ensure that integration points are properly sequenced.
- Marketing campaigns: For multi-channel marketing campaigns, Gantt charts can coordinate various activities like content creation, ad placements, and event planning across different platforms and timelines.
- Product development: In new product development, Gantt charts can manage the progression from concept to market, including design, prototyping, testing, and production phases.
- Construction projects: With numerous interdependent tasks and strict sequencing requirements, construction projects benefit greatly from the visual planning capabilities of Gantt charts.
- Event planning: For large-scale events, Gantt charts can coordinate various aspects like venue preparation, logistics, marketing, and program scheduling.
- Research projects: In academic or scientific research, Gantt charts can help manage different phases of the research process, from literature review to data collection, analysis, and report writing.
By leveraging Gantt charts in these scenarios, project managers can enhance coordination, improve resource allocation, and increase the likelihood of delivering projects on time and within scope. The visual nature of Gantt charts makes them an excellent tool for both detailed planning and high-level communication with stakeholders, ensuring everyone has a clear understanding of the project timeline and progress.
Examples of successful use of Gantt charts
Gantt charts have proven their worth across numerous industries and project types. Let’s explore some compelling examples of how Gantt charts have contributed to successful project outcomes in various fields.
- Software development: Spotify’s agile transformation
When Spotify underwent its agile transformation, they used a modified Gantt chart approach to manage their large-scale organizational change. They created a “roadmap” that resembled a Gantt chart but allowed for flexibility in their agile environment. This visual tool helped them coordinate multiple teams, track progress across different areas of the organization, and ensure that interdependent changes were properly sequenced. The result was a smoother transition to agile methodologies and improved alignment across the company.
- Construction: The Burj Khalifa project
The construction of the Burj Khalifa, the world’s tallest building, was a massive undertaking that relied heavily on Gantt charts for planning and execution. The project team used detailed Gantt charts to manage the complex sequencing of tasks, from foundation work to the installation of the spire. These charts helped coordinate the efforts of over 12,000 workers from more than 100 countries. Despite the project’s complexity, it was completed on time, a feat attributed in part to the effective use of Gantt charts for planning and progress tracking.
- Event planning: Olympic Games
The Olympic Games are one of the most complex event planning endeavors in the world. For the 2012 London Olympics, organizers used Gantt charts extensively to plan and manage the seven-year preparation period. These charts helped coordinate everything from venue construction to athlete village preparation, security planning, and the intricate scheduling of the events themselves. The successful delivery of the Games on time and budget was a testament to the power of effective project management tools like Gantt charts.
- Product launch: Apple iPhone
While Apple is known for its secrecy, it’s been reported that they use Gantt charts in their product development and launch processes. For the original iPhone launch, a complex Gantt chart reportedly helped coordinate various teams working on hardware, software, and marketing. The chart helped ensure that all components came together for the historic 2007 launch, managing dependencies between different aspects of the product and aligning them with the ambitious launch date.
- Aerospace: SpaceX Falcon Heavy development
SpaceX’s development of the Falcon Heavy rocket, one of the most powerful operational rockets in the world, relied on careful planning and execution. Gantt charts were used to manage the complex process of designing, testing, and manufacturing the rocket’s components. These charts helped SpaceX coordinate between different engineering teams, manage the supply chain for specialized parts, and schedule crucial test flights. The successful launch of the Falcon Heavy in 2018 was a result of this meticulous planning and coordination.
- Healthcare: COVID-19 vaccine development
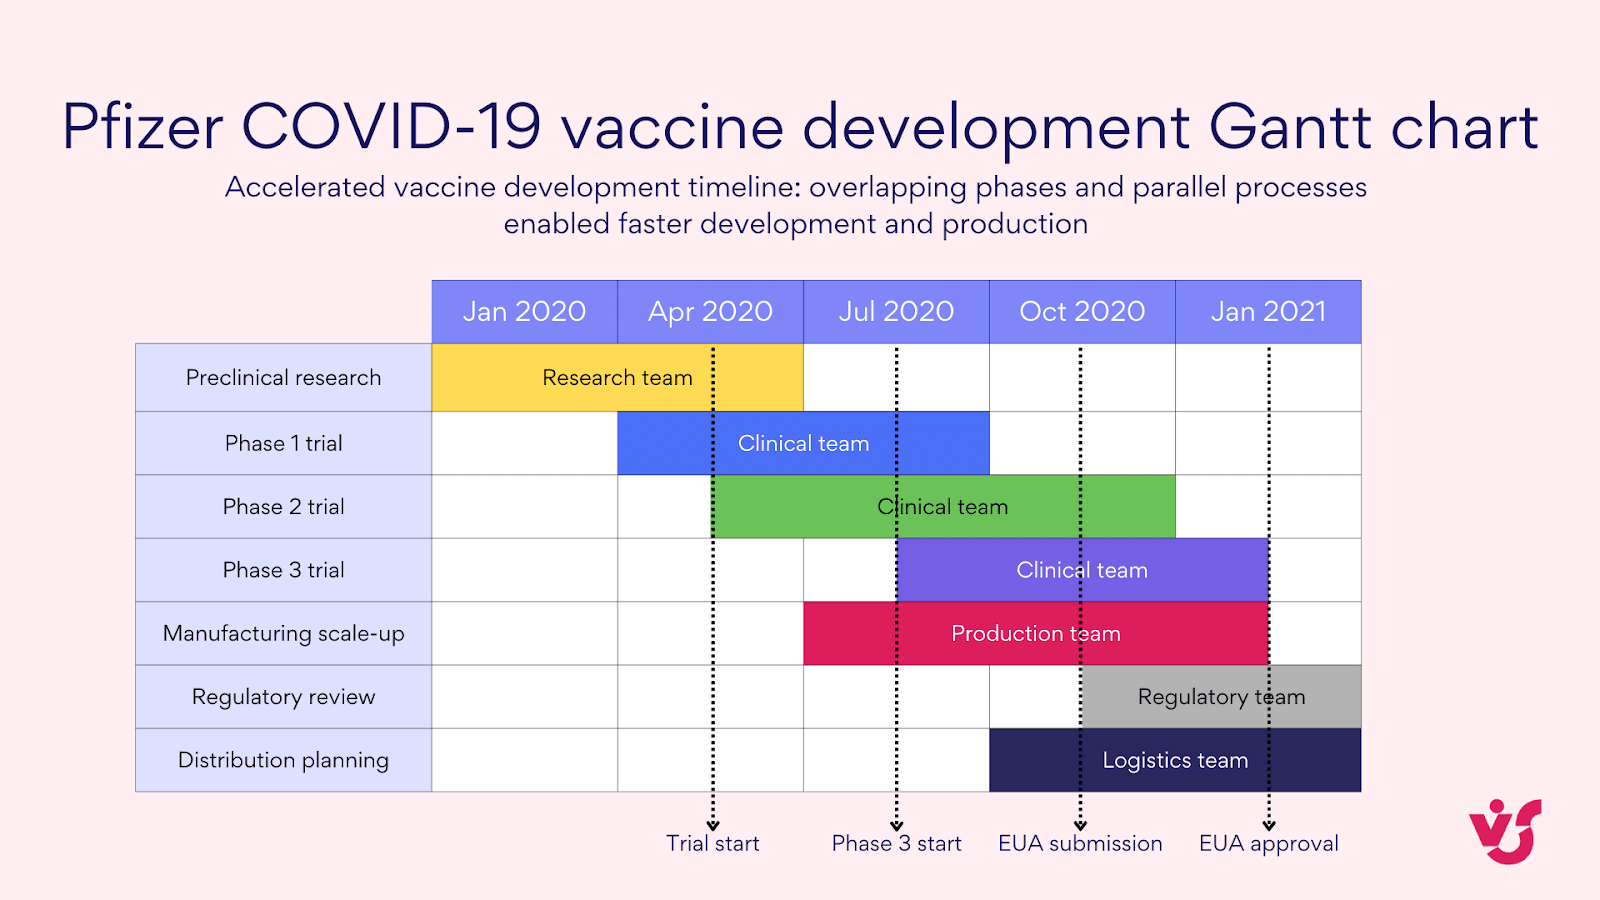
Pic. 9. Pfizer COVID-19 vaccine development Gantt chart
The rapid development of COVID-19 vaccines in 2020 was an unprecedented achievement in the pharmaceutical industry. Companies like Pfizer and Moderna used Gantt charts to manage their accelerated vaccine development processes. These charts helped coordinate multiple phases of clinical trials, manage regulatory submissions, and plan for manufacturing scale-up – all happening in parallel rather than sequentially. The ability to visualize and manage this complex process contributed to the delivery of vaccines in record time.
These examples illustrate how Gantt charts, when used effectively, can contribute to the successful planning and execution of projects across various industries.
Gantt Chart Software
Modern Gantt chart software has transformed Gantt charts from static timelines into dynamic, interactive project management hubs. In this section, we’ll take a closer look at the importance of using such sophisticated software tools and examine the key features that set specialized software apart.
Importance of using specialized software
While it’s possible to create basic Gantt charts using general-purpose tools like spreadsheets or even pen and paper, the complexity of modern projects often demands more sophisticated solutions. Specialized Gantt chart software offers a range of features that can significantly enhance your project management capabilities. Let’s explore why using dedicated tools for creating and managing Gantt charts is crucial for effective project management.
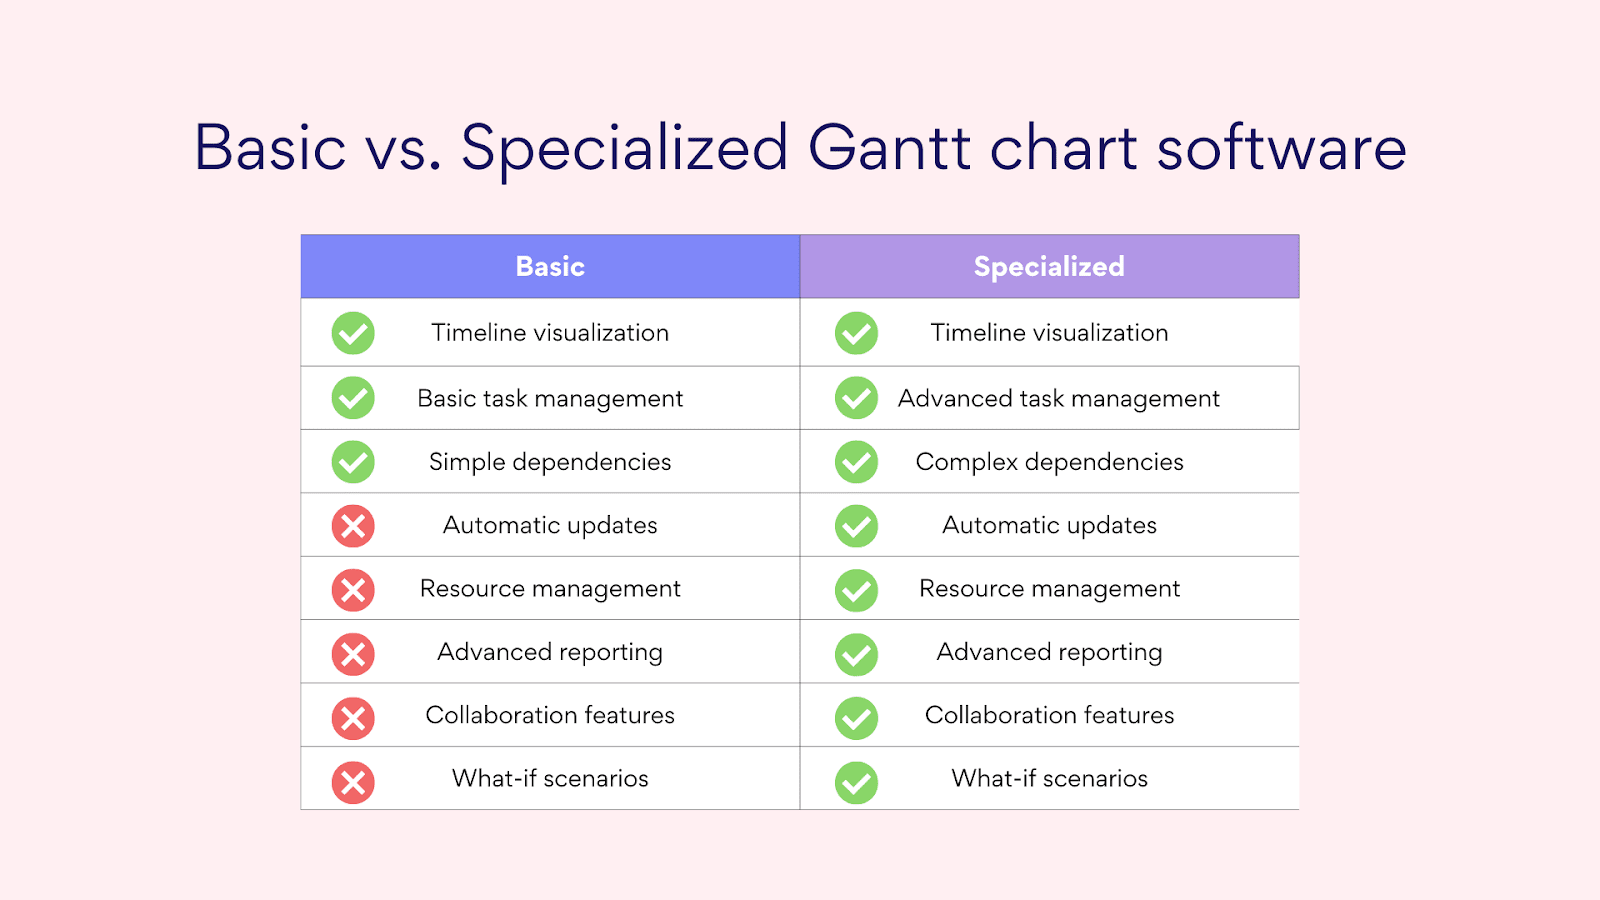
Pic. 10. Difference between basic and specialized Gantt chart software.
- Automatic data updates
One of the most significant advantages of specialized Gantt chart software is its ability to automatically update data across the entire project timeline. This feature is invaluable for several reasons:
- Real-time progress tracking: As team members update their task progress, the Gantt chart automatically reflects these changes, providing an up-to-the-minute view of the project status.
- Cascading updates: When a task’s duration or timeline changes, the software automatically adjusts all dependent tasks, saving time and reducing the risk of errors that could occur with manual updates.
- Resource allocation visualization: Many specialized tools can automatically update resource allocation views when tasks are modified, helping project managers quickly identify and resolve over-allocation issues.
- Performance metrics: Advanced software can automatically calculate and update key performance indicators like earned value, cost variance, and schedule performance index.
- Dependency management
Complex projects often involve numerous interdependent tasks. Specialized Gantt chart software excels at managing these dependencies:
- Automated dependency tracking: The software can automatically adjust dependent tasks when changes are made to a predecessor task, maintaining the logical flow of the project.
- Multiple dependency types: Advanced tools support various dependency types (Finish-to-Start, Start-to-Start, Finish-to-Finish, Start-to-Finish), allowing for more accurate representation of complex task relationships.
- Dependency visualization: Clear visual representation of task dependencies helps identify critical paths and potential bottlenecks.
- Circular dependency detection: Many tools can alert you to circular dependencies that could cause logical errors in your project plan.
- Other key benefits
Beyond these core features, specialized Gantt chart software offers numerous other advantages:
- Collaboration features: Many tools offer real-time collaboration capabilities, allowing team members to update their progress, comment on tasks, and share files directly within the Gantt chart interface.
- Integration with other tools: Specialized software often integrates with other project management and productivity tools, creating a seamless workflow across different aspects of project management.
- Advanced reporting: Generate detailed reports and dashboards that provide insights into project progress, resource utilization, and potential issues.
- What-if scenario planning: Some tools allow you to model different scenarios without affecting the baseline plan, helping in decision-making and risk management.
- Custom fields and formulas: Adapt the tool to your specific project needs by creating custom fields and formulas for calculations unique to your project or industry.
- Resource leveling: Automatically adjust task schedules to resolve resource conflicts and optimize resource allocation.
👉What is the best Gantt chart project management software? Determining the “best” Gantt chart project management software largely depends on the specific needs of your organization, project complexity, team size, and integration requirements. Popular options in the market include Microsoft Project, which offers comprehensive project management features but can have a steeper learning curve, and tools like Asana or Trello, which provide Gantt chart functionality alongside other project management features.
Conclusion
As we’ve explored throughout this article, Gantt charts stand as a cornerstone of effective project management, offering a visual and intuitive way to plan, execute, and monitor projects of all sizes and complexities. From their humble beginnings as hand-drawn diagrams to today’s sophisticated digital tools, Gantt charts have evolved to meet the ever-changing demands of modern project management.
To further your understanding of Gantt charts and project management best practices, we recommend exploring the following resources:
Official Microsoft resources:
VirtoSoftware blog articles: