Virto SharePoint Kanban Board Online — Improved Charts for Your Boards
We have updated the Virto SharePoint Kanban app and improved the block of charts and reports. How to use modified charts for your work in Virto Kanban Board — please find in our post.
Virto Kanban Board online is already available with enhanced reports and charts. For your comfort and ease of use, we have modified the way you make charts and create reports of Kanban boards.

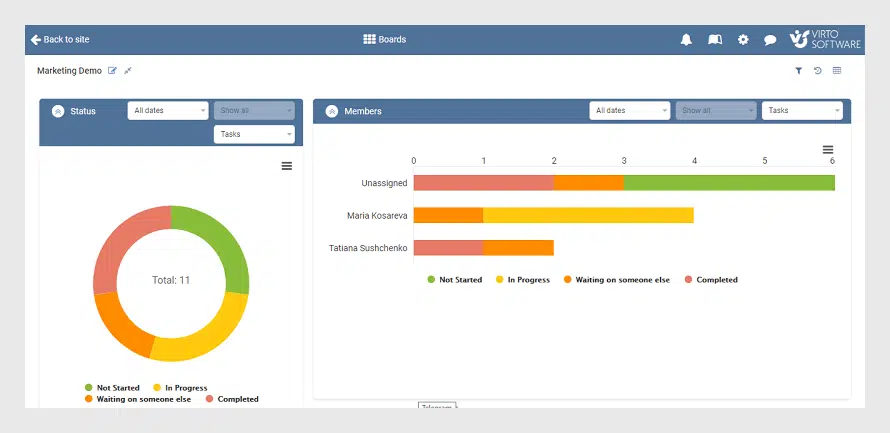
Let us see what’s new we have prepared for you! So, when you wish to gain more control and analyse the tasks of your boards, open the Kanban board you’re working with and use the charts icon in the right upper corner.
Modified Graphs
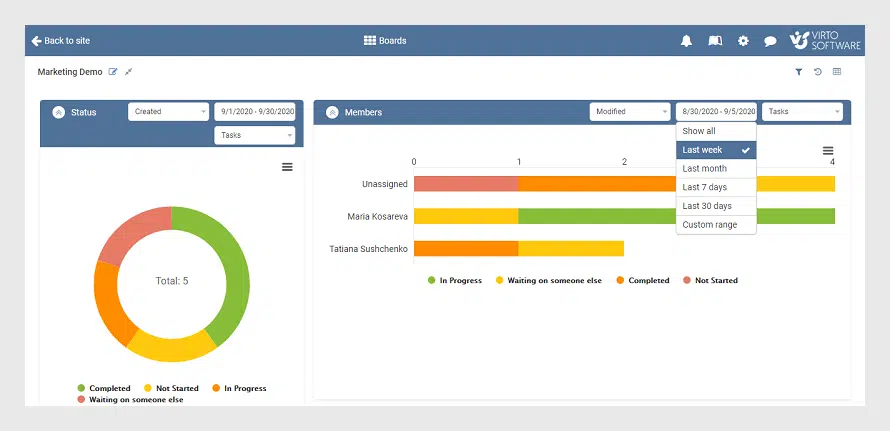
First, look at both graphs displayed on the screen. As it was before, the left one shows the Kanban board tasks of the board by status, and the right one shows tasks by members. But now you can change the parameters to form the chart and make your own analysis. For instance, choose the tasks created or modified for a required period. And what´s more, you can apply different conditions for these two charts and compare them any way you need.
Save As…
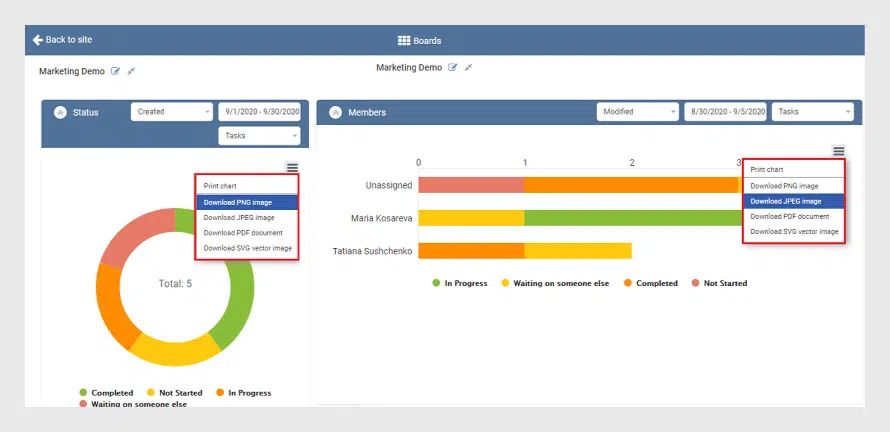
Second, we have added the opportunity of saving the chart in the most frequently used formats. Adjust your chart and print it or save as PDF, PNG, JPEG, or SVG to share with your colleagues and partners.
Analyze with Burndown
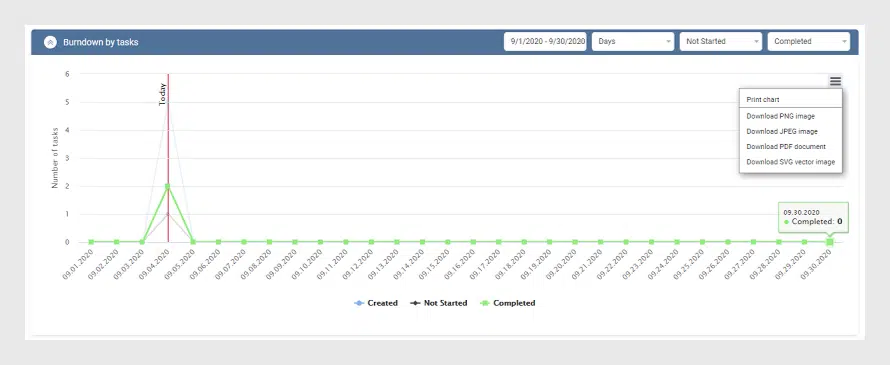
And, last but not least. Just scroll a little bit down and you will see the new burndown chart. This is one more graph to represent the work left. Now, this feature is also available for Virto Kanban Board users. The graph is formed automatically by the board tasks left. Just choose the period and start to analyze the effectiveness, for instance, of your support team. And certainly, it is also possible to print this chart or save it in the required format.
Start using the improved charts for your Virto Kanban boards and feel free to leave your feedback. Be on the lookout for our new features!
| Related Products: |
|---|
 |
| Office 365 Kanban |


