Practical Guide to Implementing and Measuring Kanban Metrics
Implementing Kanban metrics can drastically enhance workflow efficiency and productivity by providing clear, data-driven insights. This guide explores Kanban metrics, showcasing how digital tools like the Virto Kanban Board App can boost team performance.
The Kanban project management methodology centers on visualized workflows, incremental progress, and lean principles to boost collaboration. Studies show practices like explicit constraints on work-in-progress can shorten lead times, while smoother flow slashes cycle durations and accelerates delivery (1, 2).
Yet metrics remain imperative to systematically surface inefficiencies for continuous improvement. Tracking key indicators around process times and throughput rates enables fact-based prioritization, scheduling refinements and productivity forecasts.
Fortunately, leveraging the power of Kanban metrics has never been easier thanks to digital Kanban boards like the Virto Kanban Board App. These tools provide real-time data visualization, customizable dashboards, and advanced analytics, making it simple to track, analyze, and improve your team’s performance.
This practical guide explores Kanban measurement techniques, tools and use cases to shift from activity-based to truly data-driven organizations.
Basic Agile Kanban Metrics & How to Measure Kanban Metrics?
In this section, we’ll introduce you to the basic Kanban metrics and explore each of them in more detail.
What are Kanban metrics, and why are they important?
Kanban metrics are key performance indicators (KPIs) used to measure and analyze the flow of work through a Kanban system. These metrics provide insights into how well the team is performing, where bottlenecks might occur, and how processes can be improved. By tracking and analyzing these metrics, teams can make data-driven decisions to enhance productivity, reduce cycle times, and deliver higher-quality work.
What are the 4 metrics of Kanban?
The main four metrics of Kanban include:
- Lead time: Lead time refers to the total time it takes for a task to move from the initial request to its final completion. This metric is crucial for understanding the overall efficiency of your process from the customer’s perspective. Shorter lead times typically indicate a more efficient process, allowing for quicker delivery of value to the customer.
- Cycle time: Cycle time measures the amount of time a task spends in the “in-progress” phase, from when work actually begins until it is completed. This metric helps teams understand how long it takes to perform the work and can be used to identify areas for improvement within the workflow. Reducing cycle time can lead to faster throughput and more predictable delivery schedules.
- Throughput: Throughput is the number of tasks completed within a given time period. This metric helps teams understand their capacity and how much work they can deliver over time. By analyzing throughput, teams can identify trends, set realistic expectations, and ensure that they are not overcommitting or underutilizing resources.
- Work In Progress (WIP): Work In Progress (WIP) refers to the number of tasks that are currently being worked on but are not yet completed. Managing WIP is essential for maintaining a smooth and efficient workflow. Too much WIP can lead to bottlenecks, increased cycle time, and reduced quality, while too little WIP may indicate underutilization of resources. Setting WIP limits helps balance the workload and ensures that the team can focus on completing tasks without being overwhelmed.
Now, let’s explore each metric in detail, uncovering practical insights and examples for successful implementation within your own Kanban system.
Lead time
Lead time is a fundamental metric in Kanban and project management that represents the total time taken for a task or work item to move from the initial request to its final completion. In other words, it measures the duration from the moment a task is requested or added to the backlog until it is fully delivered to the customer or stakeholder. Lead time provides a comprehensive view of the entire workflow, encompassing all stages from inception to delivery.
How to measure Lead time
Measuring Lead time involves tracking the time stamps of when a task enters the workflow and when it exits as a completed item. Here’s a step-by-step process to measure Lead time:
- Start time: Record the date and time when a task or work item is requested or added to the backlog. This marks the beginning of Lead time.
- End time: Record the date and time when the task is completed and delivered to the customer or stakeholder. This marks the end of Lead time.
- Calculation: Subtract the Start time from the End time to calculate the total Lead time.
For example, if a task is requested on July 1st at 10:00 AM and completed on July 3rd at 2:00 PM, the Lead time would be:
Lead time=End time−Start time
Lead time=July 3rd, 2:00 PM−July 1st, 10:00 AM
Lead time=2 days and 4 hours
Examples of using Lead time in project management
Example 1: Software development
In a software development team, Lead time can help measure how quickly new features or bug fixes are delivered to end-users. Suppose a new feature is requested by a product manager on July 1st and it is released to production on July 10th. The Lead time would be 9 days. By analyzing Lead time across multiple features, the team can identify patterns and areas for improvement, such as delays in specific stages of the development process.
Example 2: Manufacturing
In a manufacturing setting, Lead time is crucial for understanding the efficiency of the production process. If an order for a custom product is placed on July 1st and the final product is shipped on July 15th, the Lead time is 15 days. By tracking this metric, managers can identify bottlenecks in the production line, such as delays in procurement of materials or inefficiencies in assembly, and implement strategies to reduce Lead time and improve throughput.
Example 3: Marketing campaigns
For a marketing team, Lead time can be used to measure the duration from the initial concept of a campaign to its launch. If a campaign idea is proposed on July 1st and the campaign goes live on July 20th, the Lead time is 19 days. Understanding Lead time in this context helps the team plan better and ensure timely launches of campaigns, which is critical for aligning with market trends and business goals.
As you can see, Lead time is a vital metric that provides insights into the overall efficiency and responsiveness of a workflow. By accurately measuring and analyzing Lead time, teams can identify delays, streamline processes, and enhance their ability to deliver value to customers quickly and consistently. In the next sections, we will explore other key Kanban metrics and how they contribute to effective project management.
Cycle time
Cycle time is a key metric in Kanban and project management that measures the amount of time a task or work item spends in the “in-progress” phase, from the moment work begins until the task is completed. Unlike Lead time, which encompasses the entire workflow from request to delivery, Cycle time focuses specifically on the active working period. This metric is essential for understanding the efficiency of the work process and identifying areas where improvements can be made to enhance productivity.
How to measure Cycle time
Measuring Cycle time involves tracking the time stamps of when a task starts being worked on and when it is completed. Here’s how to measure Cycle time:
- Start time: Record the date and time when the task moves from the “to-do” or backlog stage to the “in-progress” stage. This marks the beginning of Cycle time.
- End time: Record the date and time when the task is completed and moves to the “done” stage. This marks the end of Cycle Time.
- Calculation: Subtract the Start time from the End time to calculate the total Cycle time.
For example, if work on a task begins on July 1st at 9:00 AM and is completed on July 2nd at 5:00 PM, the Cycle time would be:
Cycle time=End time−Start time
Cycle time=July 2nd, 5:00 PM−July 1st, 9:00 AM
Cycle time=1 day and 8 hours
Examples and practical applications of Cycle time
Example 1: Software development
In a software development environment, Cycle time is used to measure how long it takes to complete various stages of development, such as coding, testing, and deployment. Suppose a developer starts working on a bug fix on July 1st and completes it on July 3rd. The Cycle time is 2 days. By tracking Cycle time for different tasks, the team can identify bottlenecks, such as prolonged testing phases, and implement changes to reduce Cycle time, leading to faster releases.
Example 2: Manufacturing
In manufacturing, Cycle time is critical for understanding the time taken to produce an item from the start of assembly to its completion. For instance, if the assembly of a product starts on July 1st and finishes on July 5th, the Cycle time is 4 days. Monitoring this metric helps managers identify inefficiencies in the production line and optimize processes to reduce Cycle time, thereby increasing overall production capacity.
Example 3: Customer support
For a customer support team, Cycle time can measure the duration from when a support ticket is opened to when it is resolved. If a support agent begins working on a ticket on July 1st and closes it on July 2nd, the Cycle time is 1 day. By analyzing Cycle time across multiple tickets, the support team can identify delays in response times or issue resolution and take steps to improve their processes, leading to better customer satisfaction.
Cycle time is a crucial metric that provides insights into the efficiency of the active work process within a workflow. By accurately measuring and analyzing Cycle time, teams can pinpoint areas of delay, streamline their processes, and enhance their capacity to deliver work efficiently.
Throughput
Throughput, in the context of Kanban and project management, refers to the number of tasks or work items completed within a given time period. It is a crucial metric for understanding a team’s productivity and capacity. By measuring throughput, teams can gauge how much work they are delivering, identify trends over time, and make informed decisions about resource allocation and process improvements. High throughput typically indicates a well-functioning workflow, while low throughput can signal underlying issues that need to be addressed.
How to measure Throughput
Measuring throughput involves counting the number of tasks completed during a specific time frame. Here’s a step-by-step process to measure throughput:
- Define the time period: Decide on the time period for which you want to measure throughput. This could be daily, weekly, monthly, or any other interval that makes sense for your workflow.
- Count completed tasks: Track the number of tasks that have been completed within the defined time period.
- Record and analyze: Record the throughput data and analyze it to identify patterns and trends.
For example, if you measure throughput on a weekly basis and your team completes 10 tasks in one week and 15 tasks the next week, your throughput for those weeks would be 10 and 15, respectively.
Examples of using Throughput to improve performance
Example 1: Software development
In a software development team, throughput can be used to track the number of features, bug fixes, or user stories completed each sprint. Suppose the team completes 20 user stories in a two-week sprint. By monitoring throughput over multiple sprints, the team can identify trends such as increasing or decreasing productivity. If throughput is declining, it might indicate issues such as technical debt or resource constraints that need to be addressed. Conversely, a steady increase in throughput can signal improved efficiency and process optimization.
Example 2: Manufacturing
In a manufacturing setting, throughput measures the number of units produced within a specific period. If a factory produces 200 units per day, throughput analysis can help identify whether production goals are being met and where improvements can be made. For instance, if throughput drops to 150 units per day, managers can investigate potential causes such as machinery downtime, supply chain issues, or labor shortages and take corrective actions to restore optimal production levels.
Example 3: Marketing campaigns
For a marketing team, throughput might represent the number of campaigns launched within a quarter. If the team launches 5 campaigns in Q1 and 8 campaigns in Q2, they can analyze factors contributing to the increase in throughput, such as better resource management or more efficient workflow processes. This analysis helps the team understand what strategies are working and where further improvements can be made to increase the number of successful campaigns.
Throughput is a vital metric that provides insights into a team’s productivity and capacity to deliver work. By measuring and analyzing throughput, teams can identify trends, make data-driven decisions, and implement improvements to enhance performance.
Work In Progress (WIP)
Work In Progress (WIP) refers to the number of tasks or work items that are currently being worked on but are not yet completed. In Kanban, managing WIP is crucial because it directly affects the flow of work and the efficiency of the process. By limiting the amount of work in progress, teams can focus on completing tasks rather than juggling multiple tasks simultaneously, which can lead to inefficiencies and delays. Properly managing WIP helps to maintain a smooth workflow, reduce cycle times, and improve overall productivity and quality.
How to control and measure WIP
Controlling and measuring WIP involves setting limits on the number of tasks that can be in progress at any given time and regularly monitoring these limits to ensure they are adhered to.
Here’s a step-by-step process to control and measure WIP:
- Set WIP limits: Define WIP limits for each stage of your workflow. These limits should be based on the team’s capacity and the nature of the work. For instance, you might set a WIP limit of 3 tasks for the development stage and 2 tasks for the testing stage.
- Visualize WIP: Use a Kanban board to visualize WIP. Each column on the board represents a stage in the workflow, and tasks move through these columns as they progress. The board should clearly display the WIP limits for each stage.
- Monitor WIP regularly: Regularly review the Kanban board to ensure that the WIP limits are being respected. If the number of tasks in any stage exceeds the limit, investigate the cause and take corrective action.
- Adjust WIP limits as needed: Based on feedback and performance data, adjust WIP limits to optimize the flow of work. This might involve increasing limits if the team’s capacity grows or decreasing them if bottlenecks are observed.
The impact of WIP on team performance
Improved focus and quality
Limiting WIP helps teams concentrate on fewer tasks at a time, which can significantly enhance focus and the quality of work. When team members are not overwhelmed by too many tasks, they can dedicate more attention to each task, leading to fewer errors and higher-quality outcomes.
Reduced Cycle time
By controlling WIP, teams can reduce the time it takes to complete tasks. With fewer tasks in progress, tasks move more quickly through the workflow, reducing cycle time. This efficiency gain helps in delivering work faster and meeting deadlines more reliably.
Identification of bottlenecks
Monitoring WIP limits helps teams quickly identify bottlenecks in the workflow. If a particular stage consistently exceeds its WIP limit, it indicates a problem that needs to be addressed, such as resource constraints or process inefficiencies. Addressing these bottlenecks can further streamline the workflow and enhance performance.
Enhanced predictability
Maintaining appropriate WIP limits contributes to a more predictable workflow. When the flow of work is steady and controlled, it becomes easier to forecast how long tasks will take to complete and to plan future work more accurately. This predictability is valuable for setting realistic expectations with stakeholders and managing project timelines effectively.
Work In Progress (WIP) is a critical metric in Kanban that influences the flow of work, team focus, and overall performance. Understanding and managing WIP is essential for maintaining a smooth and productive workflow.
What Are the Leading Metrics in Kanban?
While Kanban promises immense productivity gains through visual workflows and incremental progress, quantitative tracking, as we’ve discovered, proves critical for maximizing impact. Among the key leading metrics for Kanban teams, cycle time, throughput and work-in-progress limits offer uniquely actionable insights. Let’s briefly revisit those basic indicators as the most impactful before showcasing additional leading metrics:
- Cycle time: Measures the time taken for a task to move from the “in-progress” stage to the “done” stage.
- Importance: Cycle Time is a predictor of how long it will take to complete future tasks, helping teams to set realistic deadlines and manage expectations.
- Example: A development team tracks Cycle Time to identify and eliminate delays in the coding phase, leading to faster delivery of features.
- Throughput: The number of tasks completed within a given time period.
- Importance: Throughput helps in understanding the team’s capacity and productivity, allowing for better planning and resource allocation.
- Example: A marketing team uses throughput to measure the number of campaigns launched each quarter, adjusting strategies to increase the number of successful launches.
- Work In Progress (WIP): The number of tasks that are currently being worked on but are not yet completed.
- Importance: Controlling WIP prevents bottlenecks and ensures a smooth flow of tasks through the workflow.
- Example: A customer support team limits WIP to ensure agents focus on resolving tickets efficiently, thereby reducing response times.
What metric is the most important one in Kanban?
Among these leading metrics, Cycle time is often considered the most important. Here’s why:
- Predictive power: Cycle time provides a clear picture of how long it takes to complete tasks, enabling more accurate forecasting and planning.
- Process improvement: By analyzing Cycle time, teams can identify stages in the workflow that cause delays and implement changes to streamline processes.
- Customer satisfaction: Faster Cycle time lead to quicker delivery of products and services, enhancing customer satisfaction and competitiveness.
To illustrate, consider the following example: A software development team noticed that their Cycle time for bug fixes was increasing. By analyzing the Cycle time data, they identified that the testing phase was causing delays. They introduced automated testing tools, which reduced the testing time and consequently the overall Cycle time. This improvement led to more timely releases and better product quality, highlighting the critical role of Cycle time in optimizing workflows.
👉 What are Kanban developer metrics? Kanban developer metrics are specific measurements used to track and analyze the efficiency and effectiveness of software development processes within a Kanban framework. Apart from the basic indicators discussed, other metrics might include Defect rate, Deployment frequency, Code review time, Commit-to-deploy time, among others.
Other leading Kanban indicators & Kanban metrics to track
In addition to Cycle time, Throughput, Work In Progress (WIP), and Lead time, there are several other valuable agile Kanban metrics that teams can utilize to gain deeper insights into their workflow and efficiency. Here are some additional metrics in Kanban:
- Cumulative Flow Diagram (CFD): A visual tool that shows the number of tasks in each stage of the workflow over time.
- Importance: The CFD helps teams visualize the flow of work, identify bottlenecks, and understand how tasks are progressing through the workflow.
- Example: A CFD might reveal that tasks are piling up in the testing stage, indicating a need to allocate more resources to testing or streamline the testing process.
- Blocker clustering: Analyzes the frequency and duration of blockers, which are obstacles that prevent tasks from moving forward.
- Importance: Understanding blockers helps teams identify recurring issues and address root causes, thereby improving workflow efficiency.
- Example: If tasks are frequently blocked due to waiting for external approval, the team might work on streamlining the approval process or establishing clearer guidelines.
- Flow efficiency: The ratio of active work time to total elapsed time (including wait times and delays).
- Importance: Flow efficiency indicates how much of the process time is spent on actual work versus waiting, helping to identify inefficiencies in the workflow.
- Example: If the flow efficiency is low, it suggests that tasks spend too much time waiting, prompting an investigation into causes such as resource availability or process bottlenecks.
- Queue length: The number of tasks waiting to be started in a particular stage of the workflow.
- Importance: Long queues can indicate bottlenecks and potential delays, signaling the need for process adjustments or resource reallocation.
- Example: A long queue in the design stage might indicate that designers are overwhelmed, suggesting a need to hire more designers or redistribute tasks.
- Aging Work In Progress: Tracks the age of tasks that are currently in progress.
- Importance: By monitoring how long tasks have been in progress, teams can identify tasks that are taking longer than expected and may require attention.
- Example: If a task has been in progress for significantly longer than the average Cycle time, it might indicate issues such as complexity or lack of clarity, prompting a review.
- Lead time distribution: Analyzes the distribution of lead times for tasks, showing how often tasks are completed within certain time ranges.
- Importance: This metric helps teams understand the variability and predictability of their workflow.
- Example: If most tasks are completed within 5-7 days but some take much longer, the team can investigate outliers to understand and address the causes.
- Throughput histogram: A visual representation of the frequency distribution of throughput over a given period.
- Importance: The histogram helps teams understand the variability in their output and identify trends or anomalies.
- Example: If the throughput histogram shows wide fluctuations, the team can investigate factors contributing to this variability, such as changes in team size or task complexity.
- Service Level Expectation (SLE) compliance: Measures the percentage of tasks completed within a predefined time frame, known as the Service Level Expectation.
- Importance: SLE compliance helps teams manage and set realistic expectations for task completion times.
- Example: If the team’s SLE is to complete tasks within 10 days, and their SLE compliance is 80%, it indicates that 80% of tasks meet this criterion, highlighting areas for improvement for the remaining 20%.
While Cycle time, Throughput, Work In Progress (WIP), and Lead time are fundamental Kanban metrics, incorporating additional metrics like the Cumulative Flow Diagram, Blocker clustering, Flow efficiency, Queue length, Aging Work In Progress, Lead time distribution, Throughput histogram, and SLE compliance can provide a more comprehensive understanding of the workflow.
👉 What Kanban metrics in Jira are there? Just like everywhere else, in Jira, Kanban metrics are tools that help teams measure and analyze various aspects of their workflow to enhance efficiency and productivity. Some key Kanban metrics Jira include the basic ones discussed, like Cycle and Lead times, Throughput, and WIP. Others include CFD, Control chart, WIP Age, Blocked time, and Average age of WIP.
Connecting with digital Kanban boards: How the Virto Kanban Board App can help you track leading metrics and improve processes
Digital Kanban boards, like the Virto Kanban Board App, offer powerful tools to track and visualize leading metrics, making it easier to manage and optimize workflows. Here’s how the Virto Kanban Board App can help:
- Real-time tracking: The app allows teams to monitor Cycle time, Throughput, and WIP in real-time, providing immediate insights into the workflow.
- Customizable dashboards: Teams can create customized dashboards to display key metrics, ensuring that critical data is always visible and actionable.
- Analytics and reporting: The app offers robust analytics and reporting features, enabling deep dives into performance data and identification of trends and bottlenecks.
- Integration with other tools: Virto Kanban Board integrates seamlessly with SharePoint and Microsoft 365, as well as many third-party project management tools, enhancing its utility and ensuring a comprehensive view of the project’s health.
While we have previously covered Virto Kanban configuration fundamentals in our previous article on Setting Up Digital Kanban Boards, this guide details the analytics capabilities setting it apart. Below, we’ll walk you through applying pre-built reports, constructing visuals, and exporting findings to build an insights ecosystem.
To access Virto Kanban’s analytic capabilities, navigate to the “Charts” section of your Kanban board. Charts are an essential feature of the Virto Kanban Board app, providing visual insights into your workflow and helping you track key metrics.
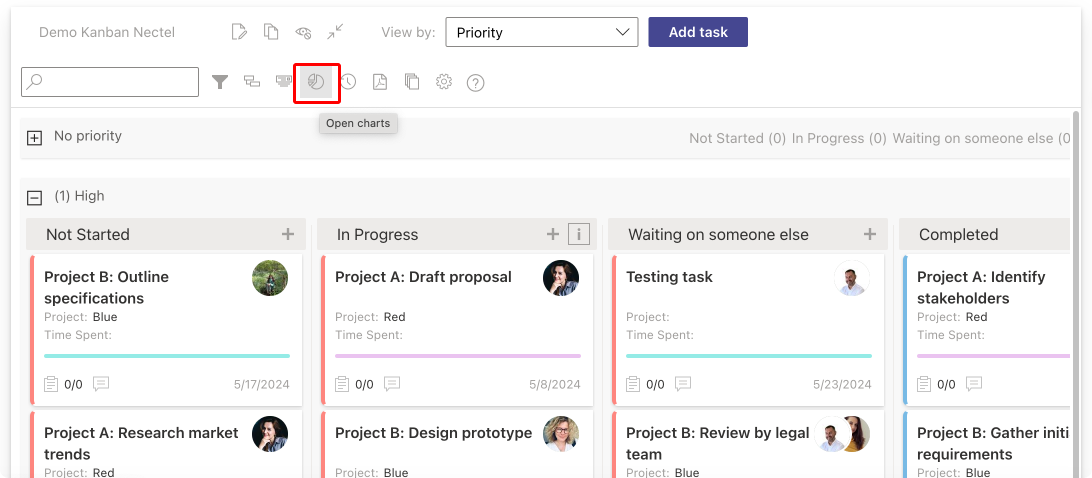
Pic. 1. Navigating to the “Charts” section.
The Virto Kanban Board app includes several types of charts, each serving a unique purpose:
- “Status” Chart
- Type: Pie Chart
- Description: This chart groups tasks by their status, providing a visual overview of the distribution of tasks across different statuses.
- Customization: You can select fields to analyze (e.g., due date), specify the time period, and choose the unit of measurement (number of tasks, percentage, or budget).
- “Assigned To” Chart
- Type: Graph
- Description: This chart groups tasks by assignees, showing which board members have modified tasks over a specified period.
- Customization: Similar to the status chart, it allows you to choose fields and time periods for analysis.
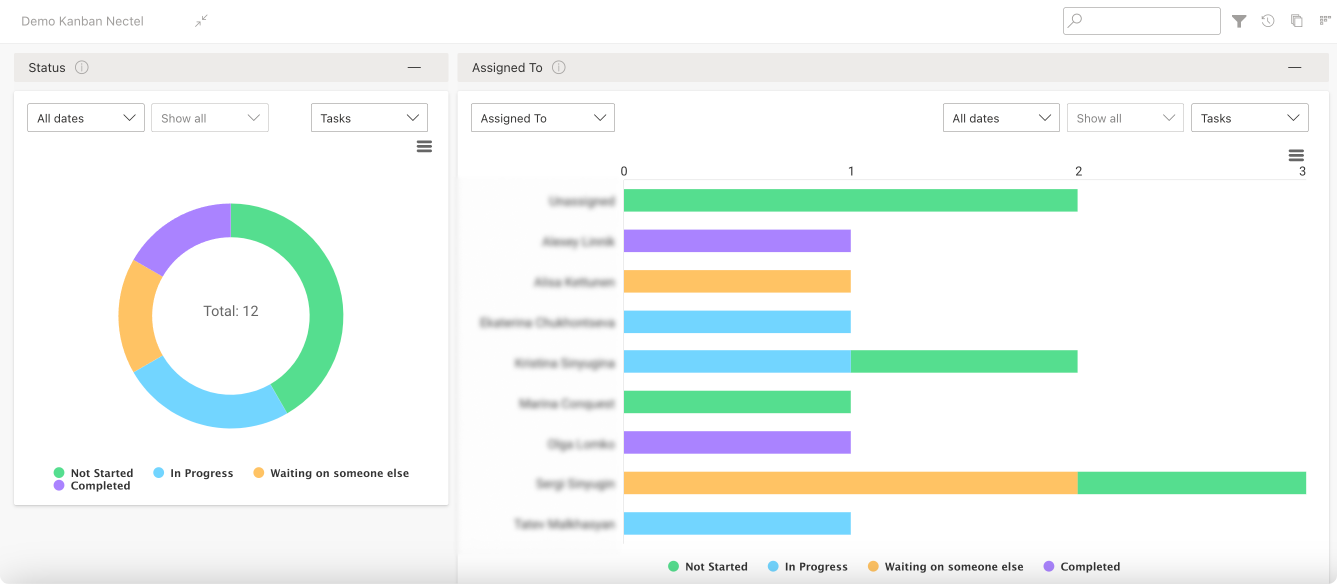
Pic. 2. Example charts: “Status” & “Assigned To”
- “Completion” Chart
- Type: Graph
- Description: This chart shows tasks that were completed on time versus those that went overdue. It includes tasks from the SharePoint source list and can display tasks in various columns like “Deferred” or “Need someone else”.
- Note: Only tasks with a due date are shown in this chart.
- “Burndown” Chart
- Type: Graph
- Description: This chart displays the amount of work remaining over time. It helps in analyzing the efficiency of task completion within a selected period.
- Customization: The desired period for analysis can be chosen to get insights into the remaining tasks.
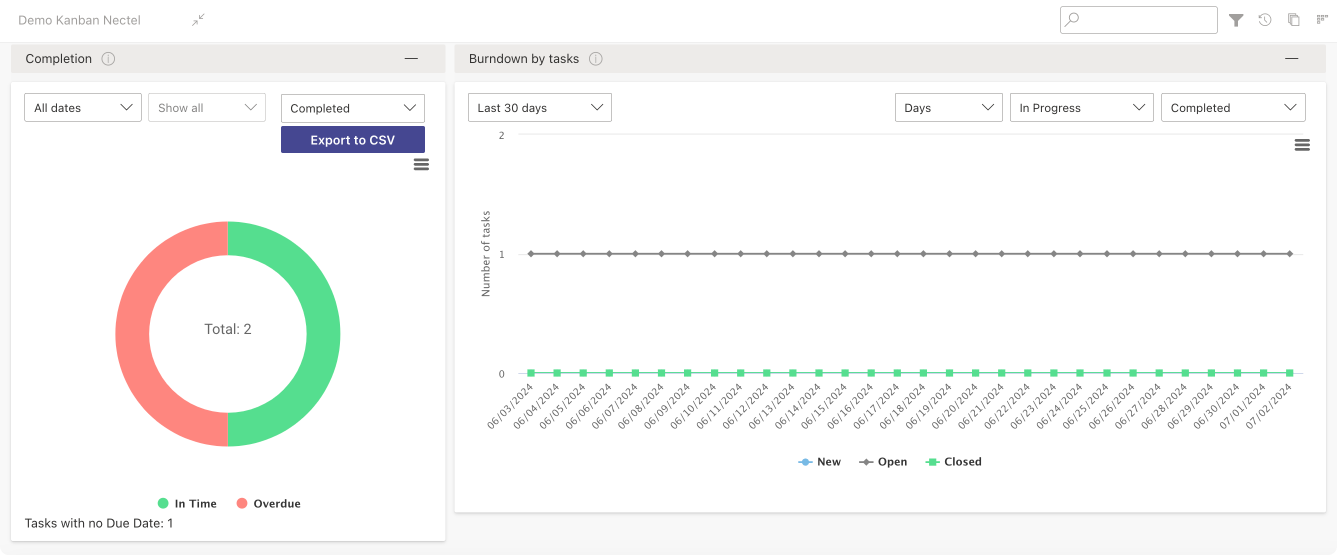
Pic. 3. Example charts: “Completion” & “Burndown”.
- “Lead Time” Chart
- Type: Graph
- Description: This chart measures the total time taken from the creation to the completion of work items, providing insights into the duration of the workflow.
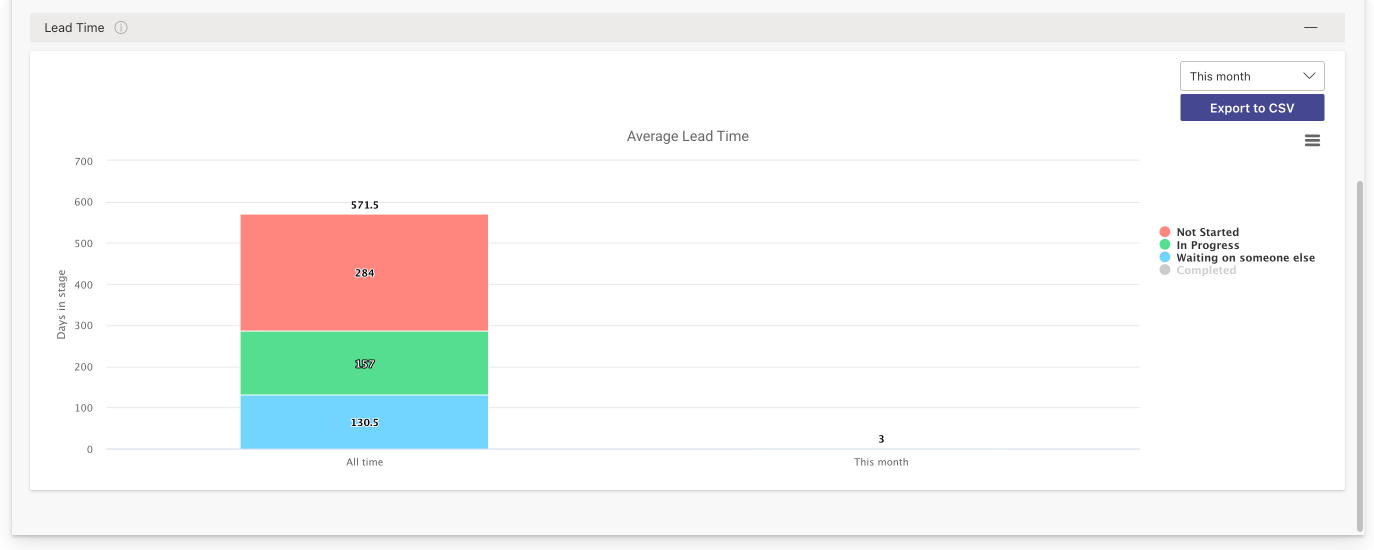
Pic. 4. Example chart: “Lead Time”
The Virto Kanban Board App also provides options to share and export charts for reporting and collaboration. You can print your charts, download them as png, jpeg, or svg vector images, or pdf files.
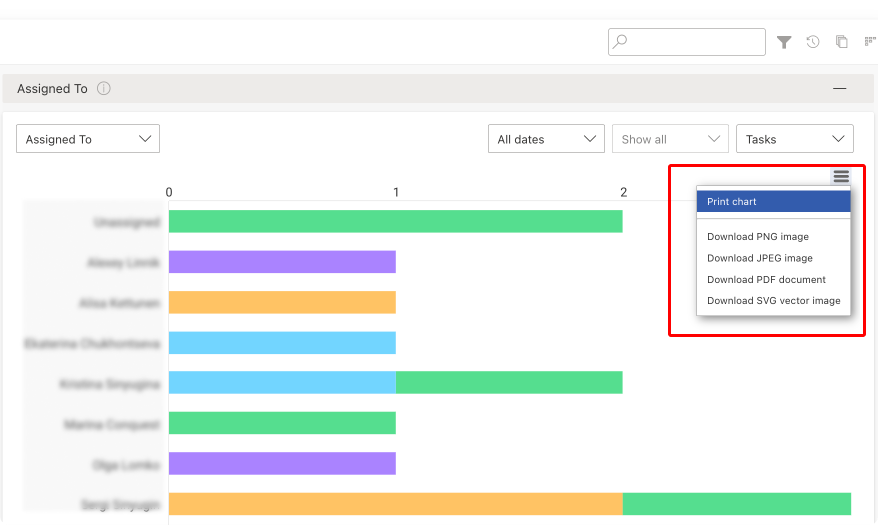
Pic. 5. Exporting and downloading your charts for further analysis.
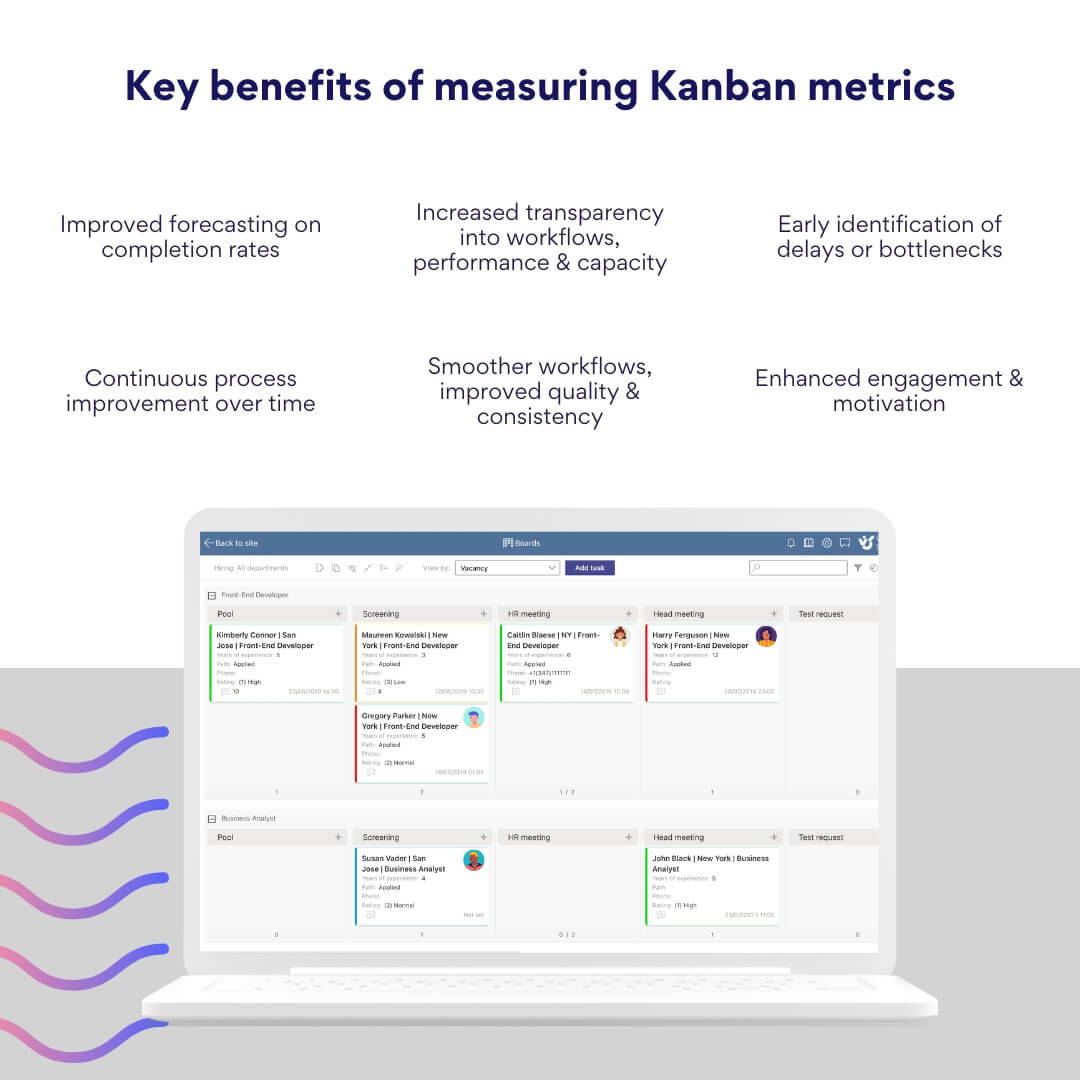
Virto Kanban’s integrated charts transform task flows into transparent, quantified workflows. With digestible, real-time dashboards highlighting completion rates, lead times, and statuses, you can spot emerging bottlenecks early and adjust assignments to maintain sustainable velocities.
👉 To gain a deeper understanding of how else the Virto Kanban Board app can help you enhance your agile project management, explore the insights and examples provided on the “Agile Kanban Project Management” use case page. For a user guide, refer to the Virto Kanban Board App Learning Page.
Implementing, Measuring, and Tracking Kanban Metrics
In this section, we’ll take a look at implementing and tracking agile Kanban metrics within a team. We’ll suggest methods and tools for tracking these metrics and explain how digital boards can help you effectively monitor and optimize your workflow.
Practical guide to implementing and tracking Kanban metrics in a team
- Define key metrics: Identify which metrics for Kanban are most relevant to your team’s goals. As we’ve discussed, common metrics include Lead time, Cycle time, Throughput, Work In Progress (WIP), and Cumulative Flow Diagram (CFD).
- Set up your Kanban board:
- Create columns that represent the stages of your workflow (e.g., To Do, In Progress, Done).
- Ensure everyone on the team understands the purpose of each column and how to move tasks through the workflow.
👉 For a thorough, comprehensive guide on setting up your Kanban board, consider reading our previous article on the topic: Guide to Setting Up Your Digital Kanban Board.
- Establish WIP limits: Set limits on the number of tasks that can be in progress at any given time to prevent bottlenecks and ensure a steady flow of work.
- Regular stand-ups and reviews:
- Hold daily stand-up meetings to discuss progress and any blockers.
- Conduct regular reviews (e.g., weekly or bi-weekly) to analyze metrics and discuss improvements.
- Track metrics consistently:
- Ensure that all team members consistently update task statuses to maintain accurate data.
- Use tools and methods to record and visualize metrics regularly.
Practical tips for implementing, measuring, and tracking Kanban metrics
- Start small: Begin with a few key metrics and expand as your team becomes more comfortable with the process.
- Educate your team: Ensure everyone understands the importance of metrics for Kanban and how to measure them.
- Automate data collection: Use digital tools to automate the tracking and reporting of metrics whenever possible.
- Visualize data: Use charts and graphs to make the data more accessible and easier to interpret.
- Set goals: Establish clear goals based on your metrics to guide your team’s efforts and improvements.
- Review and adjust: Regularly review your metrics and make necessary adjustments to your workflow and WIP limits.
👉What are Kanban flow metrics? Flow metrics Kanban are key indicators used to measure and analyze the performance and efficiency of a workflow managed by a Kanban system. Some essential Kanban flow metrics include the already mentioned Lead time, Cycle time, Throughput, and Work In Progress (WIP). Others typically include Arrival rate, Exit Rate, and Flow efficiency. For instance, the Arrival rate is the rate at which new work items are added to the backlog or workflow; the Exit rate is the rate at which work items are completed and exit the workflow; and Flow efficiency is the ratio of value-adding time to the total cycle time.
Methods and tools for tracking metrics
- Manual tracking: Record metrics manually using spreadsheets or whiteboards. This method is simple but can be time-consuming and prone to errors.
- Kanban software tools: Use digital Kanban tools like Jira, Trello, Asana, or Virto Kanban Board to automate data collection and generate reports. These tools often include built-in analytics features.
- Spreadsheets: Use spreadsheets for logging data and creating custom charts and reports. This method offers flexibility but may require more effort to maintain.
- Third-party analytics tools: Integrate your Kanban board with third-party tools like Power BI or Tableau for advanced data analysis and visualization.
How digital Kanban boards can help you track metrics
Digital Kanban boards offer several advantages for tracking metrics:
- Automation: Digital boards automatically track key metrics such as Lead time, Cycle time, and Throughput, reducing manual effort and minimizing errors.
- Real-time data: Access up-to-date metrics in real time, enabling more responsive decision-making.
- Visualization: Digital boards often include built-in charts and graphs, such as Cumulative Flow Diagrams, making it easier to visualize and interpret data.
- Integration: Many digital Kanban tools integrate with other software, such as project management or analytics tools, to provide a comprehensive view of your workflow.
- Accessibility: Digital boards can be accessed from anywhere, making it easier for remote or distributed teams to collaborate and track metrics.
👉 For practical suggestions on the best digital Kanban apps and tools, consider reading the following articles: Best Kanban Board Apps for Microsoft Teams & Online Kanban Board TEST_2025.
Real user perspectives on implementing and tracking metrics Kanban
Beyond high-level guidance, real-world implementation proves indispensable for extracting maximum value from metrics in Kanban. That’s why we turned to the Kanban community itself—crowdsourcing tips, tricks and suggestions from practitioners driving quantified implementations across industries. Find inspiration in the metrics-driven journey of teams just like yours while charting your own path toward process excellence.
Unlocking 30% throughput surges through Kanban metrics
Kanban practitioner Karolina Dacheva, Strategic Operations and Portfolio Manager at Businessmap, has overseen implementations across small specialized teams and enterprise-wide rollouts. Her methodology centers on tracking the key metrics that we’ve been discussing throughout this article, namely lead and cycle time, throughput, and WIP.
As Dacheva explains, “Our approach includes several life hacks that have proven to be highly effective. Firstly, we always start with clear visualization of the workflow. Next, limiting WIP helps us keep a tab on our current commitments and prevents us from overstretching resources. Keeping track of lead and cycle time assists us in visualizing potential bottlenecks which aids future planning.”
In particular, Dacheva highlights the direct impact of their Kanban implementation on their key performance indicator: throughput. This data-driven approach, supported by Businessmap’s own toolset, has yielded a significant increase in their delivery rate, demonstrating the power of their chosen methodology. “By monitoring and optimizing throughput, we increased our delivery rate by 30% over the previous quarter,” she explains.
“Remember, tracking and implementing Kanban is a continual process; there’s always something to learn and improve,” Dacheva concludes, emphasizing that Kanban is not a “set it and forget it” solution. Instead, it requires ongoing analysis, adaptation, and a commitment to continuous improvement.
Dacheva’s colleague, Gabriel Lukov, a certified Kanban Trainer and Head of Inbound Growth at Businessmap, also offers valuable perspectives on effectively implementing and monitoring metrics for Kanban. Lukov passionately advocates for employing visual tools like digital Kanban boards because they offer unmatchable transparency and foster accountability within the team. He also adds to the importance of measuring throughput. Tracking this metric weekly and monthly allows his team to identify trends, pinpoint bottlenecks, and optimize their workflow for maximum efficiency.
“To maintain an optimal Work in Progress (WIP), we keep a strict WIP limit aligned with our team’s capacity. This practice reduces multitasking and ensures smoother and quicker workflow progression,” continues Lukov.
But utlimately, Lukov believes that “consistency in monitoring these metrics and adapting based on their trends forms the key to successful Kanban implementation.”
Visualizing productivity through online Kanban analytics
Adil Farooq, CEO of Silverstone Technologies, also has not ventured beyond the basic key metrics like Lead time, Cycle time, Throughput, and WIP because these show everything he needs to understand if his team is going into the right direction.
“We started with simple spreadsheets for tracking metrics,” he explains. “But as our needs grew, we transitioned to online Kanban boards with built-in analytics.” For Farooq, visualizations proved critical. Transitioning to tools like Trello, teams gained deeper insights through digestible reporting. Farooq continues, “Seeing the data come alive fostered a sense of ownership and healthy competition within the team.”
This exemplifies balanced adoption—starting with basic metrics then layering in dimensions. Online boards provide the flexibility to visualize productivity gains over time. As Farooq concludes, “By tracking Kanban metrics, we’ve significantly reduced lead times. Our clients are happier with faster turnaround times, and the team feels more empowered and productive.”
From bottlenecks to breakthroughs: Kanban metrics for recipe development success
Lisa Richards, CEO and Creator of The Candida Diet, understands that delivering high-quality recipes quickly is crucial for helping her customers overcome their health challenges. To optimize this process, her team has embraced Kanban metrics, focusing on two key performance indicators: lead time and cycle time.
“We focus on a few primary metrics, which measure concrete aspects that directly affect our day-to-day workflow,” Richards explains. “As a service that creates and publishes recipes online for people to read and interact with, the most obvious metric to track is lead time: the absolute time it takes a recipe to move from concept to publication. It is obviously critical that we pay close attention to this, pinpointing the specific steps in the process that cause bottlenecks, and iterating on our workflows to adjust and accommodate. For instance: we saw that recipe testing was getting backed up. This led to a bottleneck, so we hired a person entirely dedicated to testing recipes, which significantly cut down on lead time,” she says.
By closely monitoring lead time, the Candida Diet team can identify and eliminate roadblocks in their recipe development pipeline. This data-driven approach allows them to make informed decisions, like bringing on a dedicated recipe tester, which directly translates to faster delivery times for their customers.
Richards continues, highlighting the importance of cycle time: “Another important metric that we track is cycle time: this measures how long a recipe developer actively works on a recipe. In another instance, we found that one of our recipe developers was spending a lot of time researching very specific anti-candida ingredients in her cycle time. So we created a shared ingredient library, with information readily available in one place, saving precious time for recipe development,” she says.
Analyzing cycle time allowed the Candida Diet to pinpoint inefficiencies within the recipe development process itself. By creating a shared ingredient library, they empowered their developers to work smarter, not harder, freeing up valuable time for recipe creation.
The results of this Kanban-driven approach speak for themselves: “Our utilization of Kanban metrics translates into a 20% decrease in the amount of time required to develop recipes, and a 15% improvement in developer efficiency. By speeding up the rate at which we deliver high-quality anti-candida recipes to our customers, we’re empowering more people to overcome their health issues with a delicious and effective diet,” Richards concludes.
Summary tables and recommendations
For your easy reference, we’ve prepared a comparison table of key Kanban reporting metrics, summarizing their definitions, purposes, and methods of measurement:
| Metric | Definition | Purpose | Method of measurement |
| Lead time | Total time from the initial request to task completion. | Measures overall efficiency and helps identify delays in the entire process. | Record start and end dates manually or use Kanban tools that track this automatically. |
| Cycle time | Time from the start of work on a task to its completion. | Focuses on the efficiency of the actual work process, excluding waiting times. | Record the start of work and completion dates manually or use Kanban tools for automatic tracking. |
| Throughput | Number of tasks completed in a given period. | Indicates the team’s productivity and helps in capacity planning. | Count completed tasks manually at regular intervals or use reports from Kanban tools. |
| Work In Progress (WIP) | Number of tasks currently being worked on. | Helps manage workload and identify bottlenecks. | Regularly count tasks in the “In Progress” column or monitor WIP limits set in Kanban tools. |
| Cumulative Flow Diagram (CFD) | Visual tool showing the number of tasks in each state over time. | Provides a comprehensive view of workflow stability and identifies bottlenecks and trends. | Use Kanban tools to generate CFDs automatically or manually log data in spreadsheets and create charts. |
While individual Kanban metrics quantify critical dimensions of team productivity, analyzing indicators in unison unlocks a holistic perspective guiding data-backed refinements. That’s why, based on generic tips, our own experience, and community-validated guidance, we’ve prepared another table with recommendations for combining Kanban metrics and the impact of these combinations on analytics and performance:
| Metric combination | Recommendations for combination | Impact on analytics and performance |
| Lead Time + Cycle Time | – Track both metrics to differentiate between waiting times and actual work times. | Provides a comprehensive view of the entire process, helping to identify delays and optimize both planning and execution. |
| – Use cycle time to pinpoint inefficiencies in the actual work process. | Helps in better forecasting and setting realistic timelines. | |
| – Analyze lead time to understand overall process efficiency. | ||
| Cycle Time + Throughput | – Monitor cycle time to ensure tasks are completed efficiently. | Combining these metrics helps in understanding the relationship between work duration and productivity. |
| – Track throughput to measure productivity levels. | Enables better capacity planning and workload distribution. | |
| – Use throughput data to adjust WIP limits and optimize workflow. | ||
| Throughput + WIP | – Regularly review throughput to understand team capacity. | Balancing throughput with WIP limits ensures a steady flow of tasks, reducing bottlenecks and improving workflow. |
| – Adjust WIP limits based on throughput data to avoid overloading the team. | Enhances team productivity and focus by preventing task overload. | |
| – Use WIP limits to maintain a sustainable work pace. | ||
| Cycle Time + CFD | – Use cycle time data to understand how long tasks stay in different stages. | Combining cycle time with CFDs provides a detailed view of process stability and flow efficiency. |
| – Analyze CFDs to visualize task distribution and identify bottlenecks. | Helps in identifying stages that cause delays and areas that need process improvement. | |
| – Adjust processes based on insights from both metrics to improve flow. | ||
| Lead Time + Throughput + WIP | – Track lead time to measure overall efficiency. | Provides a holistic view of the process, helping to balance efficiency, productivity, and workload. |
| – Monitor throughput to gauge productivity. | Enables better decision-making regarding process adjustments and resource allocation. | |
| – Adjust WIP limits to maintain a steady throughput while reducing lead time. |
Conclusion
In summary, Kanban reporting metrics are essential tools for assessing and improving project workflows. Key metrics such as Lead time, Cycle time, and Throughput provide invaluable insights into the efficiency and health of your processes. Proper measurement and analysis of these metrics are crucial for the successful implementation of Kanban, as they enable teams to identify bottlenecks, optimize performance, and ensure continuous improvement.
Furthermore, the use of digital and online Kanban boards significantly enhances performance monitoring, providing real-time data and facilitating remote collaboration. These tools help teams maintain visibility and control over their tasks, ensuring that everyone is aligned and that projects stay on track.
To boost your productivity and streamline your workflow, try the Virto Kanban Board App. It’s designed to help you harness the full potential of Kanban methodology with ease and efficiency. Why not schedule a quick demo call now to find out more?
For more resources on project management and Kanban methodology, explore the following articles:
- Mastering Multiple Projects: Effective Strategies & Tools
- Kanban Swimlanes Mastering: A Comprehensive Guide
- Online Kanban Boards: Guide, Examples, and Best Tools
- Top 10 Kanban Board Apps & Integrations for Microsoft Teams
- Microsoft Teams Project Management: The Complete Guide TEST_2025
- Project Management Blog: Virtosoftware’s Expert Insights
- Task Management Tips | Virtosoftware Blog
- Agile Kanban: Maximizing Project Management Efficiency
References: