Introduction
The importance of business intelligence is rather hard to overestimate, and this statement could be applied to pretty much any industry out there. SharePoint is not an exception to this rule, and it’s also easy to see how companies showed lots of interest in SharePoint reporting as a feature in recent years. As with any similar situation on the market, the increase in popularity of SharePoint reporting tools led to an entire market of SharePoint reporting becoming more active. Newer solutions are getting developed and compete for the customer’s attention, and older, existing solutions implement newer features to keep up with the demand, as well as with the competition.
Top 6 SharePoint reporting tools
Auditing, useful insights, business intelligence – all of this is constantly worked on and improved since every company strives to be the leader of the SharePoint reporting field. However, it is tough to say that a specific solution is an undisputed leader since most of the solutions cater to a specific use case or client type. That way, there is really no solution that fits literally every potential use case of every company that seeks a set of SharePoint reporting tools. However, we can point out several solutions that are some of the best in the field – there would be four such solutions. You can see our own list of the top 6 SharePoint reporting tools below.
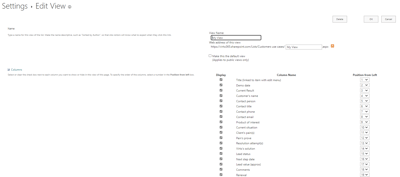
CardioLog Analytics is a rather famous SharePoint reporting tool, mostly used for SharePoint site optimization – so that all of the site’s elements are easy to access for the end-users. It works as a SharePoint Online reporting tool, and as a SharePoint On-Premise solution, as well. As with most of the solutions on the list, while CardioLog Analytics has a diversified set of features and benefits – it is still a reporting solution, first and foremost. It can provide educated insights based on the collected data, and provide extensive analytical results about the site in question – including metadata, content types, and many other metrics. Speaking of additional capabilities, CardioLog Analytics also offers a variety of dashboard templates for all kinds of analytical information – like traffic sources, unused sites, site navigation, most popular pages, and more. All of the analytical results and information can be easily exported in several different formats/methods, as well. Unfortunately, it does have its own shortcomings, such as the high maintenance/upkeep cost and a generally higher cost when compared with most competitors. There’s also the user limit (up to 25 users, at most, for the enterprise version), and the standalone application requires the latest .NET framework package to work properly, as well.

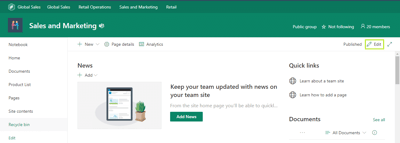
We can’t really write about any kind of SharePoint reporting tool list without mentioning Power BI – Microsoft’s ultimate solution in the field of business intelligence. At its core, it is a set of data visualization tools for various purposes – but mostly for developers, business owners, and analytical departments. Power BI is capable of connecting to many different sources of information, aggregating everything in a timely fashion into one single source of truth. It is capable of working as a SharePoint Online reporting tool, as well as its On-Premise counterpart, and it also can pull that same data faster with the usage of SQL – allowing Power BI to connect directly to the SharePoint Database to make the overall data collection process that much faster. Power BI offers extensive user reports that are easy to customize, as well as report embedding feature, and many other features. Most of the reporting features of Power BI are effectively free, but sharing reports and other information requires a Power BI Pro subscription. There’s also the fact that the number of developer-specific tools within Power BI is rather small, limiting their ability to generate anything more than simple reports. There are also no adoption/user engagement templates, and no way to generate dashboards via the Mobile view.

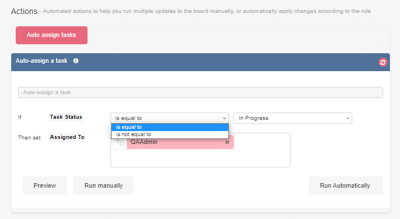
If we’re looking for something specific for auditing purposes, there’s always Netwrix Auditor – a variation of a SharePoint reporting tool that is capable of auditing security policies, user permissions, SharePoint groups, and more. It also offers the ability to generate automatic alerts, allows for an extensive search over all of the information, and approaches audit logs storing as seriously as possible. The solution itself is easy to work with and does not have a complicated installation process. There’s also a free version of the software – the so-called “Free Community Edition”, but this one’s features are greatly limited when compared with the full version of the software. It would be fair to mention that Netwrix Auditor also has its own problems, such as the lack of extensive customization (and the existing customization capabilities are greatly limited), as well as the lack of information about the exact operations during the data collection part of the audit. Additionally, even if the interface itself seems quite approachable, it is not as user-friendly as it could’ve been due to the sheer number of options and features available all at once.
Since we’ve moved on to talk about somewhat specific fields, we can talk about the niche that is usage reporting – and one of its strongest contributors, HarePoint Analytics. It is somewhat case-specific, but that doesn’t change the fact that HarePoint Analytics is a wonderful usage reporting tool that provides an overview of the entirety of your SharePoint information in terms of performance/usage metrics. While HarePoint Analytics is somewhat limited in its capabilities, it’s not just about usage reporting, either. There are also multiple different report variations, including document size, document popularity, and several other useful options. It also combines with the fact that HarePoint Analytics could be used as a SharePoint Online reporting tool, and not just as an addition to a standalone SharePoint application. One of the biggest use cases for this tool is an incident investigation – it helps a lot when you need to recreate what happened and even which specific device was used to start the chain of malicious activity. It could also be used to generate descriptive reports and customize them to a high degree of detail. On the other hand, HarePoint Analytics is quite lackluster when it comes to generating various types of visual reports, such as charts. In addition to that, it’s not exactly user-friendly, and it does offer only a limited field of reporting – statistics and usage, for the most part, so it most likely can’t cover the entire company’s needs and is more of a solution for a specific niche.
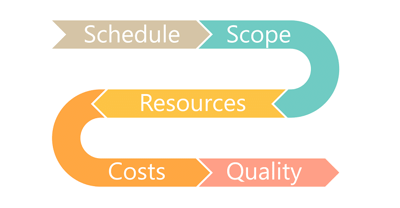
While Microsoft Visio is a graphics-related application through and through, it’s also a great way to report various information in a form that is easy to understand – with various types of diagrams. As with most Microsoft products, Visio has several versions of its software – Standard and Professional. The latter offers more templates and object types for advanced diagram types and several more advantages. If this is relatively obvious for you – the existence of Visio Services is pretty much a mystery for the majority of SharePoint users. Visio Services is pretty much the only thing that makes Visio viable for this list – it can render Visio diagrams in a web form, removing the need for Visio Viewer to be installed in the first place, and it can also be used to recalculate diagram parameters or the visuals of a diagram that is hosted on a SharePoint site. This kind of feature set allows Visio to be a rather interesting choice when it comes to SharePoint reporting. It can be used to simplify some of the more complex statistical parameters so that you can achieve a better understanding of your company as a whole. The addition of Visio Services also allows your diagrams to stay up-to-date and remove the potential problem of outdated information altogether.
- PerformancePoint Services / Dashboard Designer
For the sake of equality, it’s also fair to mention services that offer the ability to analyze performance and create dashboards for On-Premise versions of SharePoint – and the combination of PerformancePoint Services and PerformancePoint Dashboard Designer is one such example. PerformancePoint Services is an analytical service that offers you multiple different ways of analyzing your company’s productivity, as well as several similar parameters based on various KPIs. The addition of PerformancePoint Dashboard Designer allows you to generate sophisticated dashboards out of said data via scorecards, too. While it is a rather useful solution for many different reporting purposes within SharePoint, it is pretty much abandoned now, with PerformancePoint Services not receiving any meaningful updates since the release of SharePoint 2016, and does not have any kind of adaptation to SharePoint Online. This is why it’s only recommended if you’re using older SharePoint versions in the first place.
Conclusion
As you can see, there’s no objectively best solution in this particular field, and the market itself is quite varied – with examples of both specific solutions for a narrow use case, and an encompassing toolset trying to cover everything at once. We hope our list of top 6 SharePoint reporting tools was helpful to you in figuring out what to use yourself.