Reports from SharePoint lists
Presentation is important for pretty much any data source – and SharePoint lists are no exception. Even if you have all of your SharePoint lists filled with interesting data, it would still be more or less useless unless you can present it in an understandable fashion. Especially when it comes to reports for higher-ups, you’ll most likely need dashboards, KPIs, gauges, and so on.
Luckily enough, SharePoint does have a few reporting options that can be used in this scenario. It’s also possible to figure out that there are two basic approaches to a SharePoint list report here – to use an out-of-the-box solution, or to use a dedicated reporting solution.
In our scenario, an out-of-the-box solution is represented by the ability of SharePoint to generate custom views within the SharePoint list/page, and a dedicated reporting solution that we’ll be using as an example is Power BI.
Custom SharePoint list views
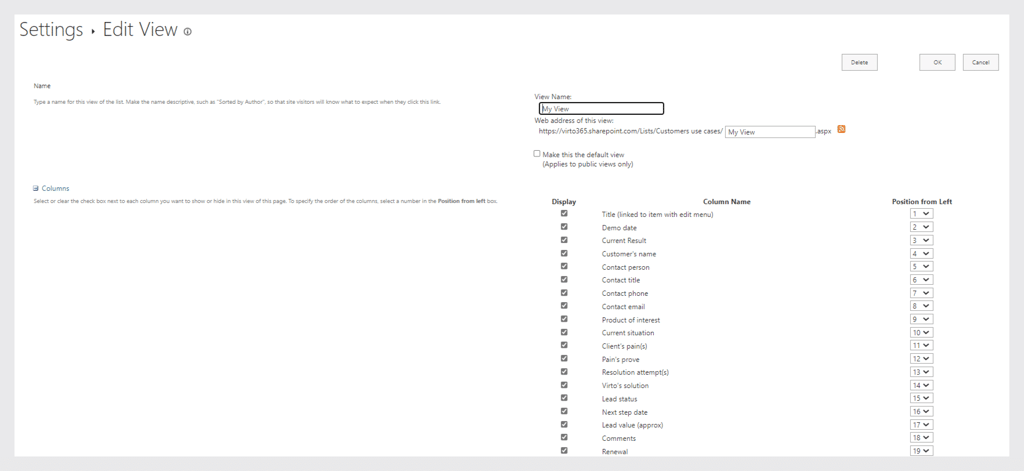
SharePoint’s own capabilities when it comes to customizing how you can view a list are quite vast, to say the least. You can generate custom views on your list, filter or sort out the specific content, and even change the viewing style of the entire page. View generation can also be done in two ways: a personal view (for yourself) and a public view (for everyone who can use the list, requires specific permissions).
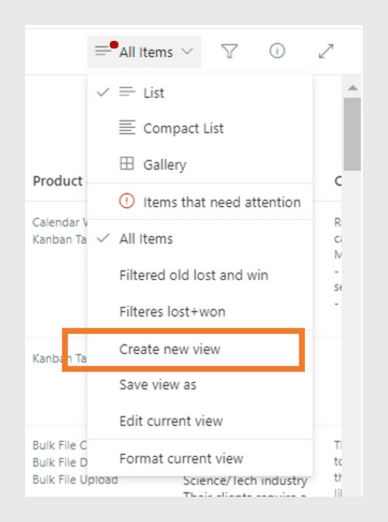
To begin this process, open up your SharePoint list and click a “View options” menu that is located at the upper right part of the screen (it shows both the chosen viewing type and the name of the view itself – although it would most likely be “All items” by default in most cases).
In this menu, you can both change the view type from “List” to “Gallery” or “Compact List”, and you can also either choose one of your own custom views to use, or create a completely new one, with buttons like “Create new view”, “Save view as”, and so on.
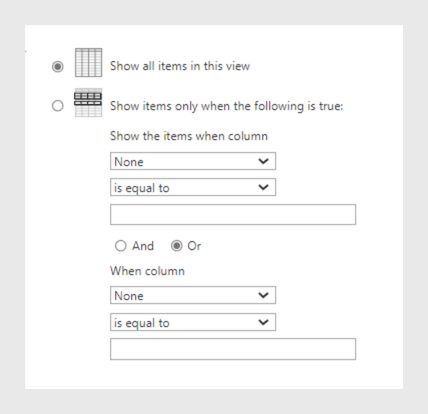
Aside from the fact that SharePoint allows you to sort each of your lists in accordance to one column’s data (in alphabetical or reverse alphabetical order, for example), you can also filter out specific content in your SharePoint list in that same menu (with the “Filter by” button), or group the content in the same way (“Group by …”).
After applying all of the filtering and sorting options that you want to use, you can also save this specific set of settings, or, as it is called in SharePoint, “to save a view”. To do that, you’ll have to click the “View options” menu again and click the “Save view as” button, which would prompt you to input a name for your future view, as well as to choose between making this view public or private.
On its own, modifying your view on a SharePoint list is already technically a SharePoint list report, since it shows the same data in a more accessible way – be it by filtering out specific options or by grouping options together. However, what if we want to see actual charts and diagrams as our SharePoint list report? This is where dedicated reporting tools such as Power BI come in.
Power BI reports based on SharePoint lists
Power BI is Microsoft’s own business analytics service that aims to combine business intelligence capabilities with impressive visuals and an interface that is easy enough to work with for most end users. It is mostly used to create dashboards, reports, and so on.
It is also integrated into SharePoint quite well, with the ability to generate a comprehensive SharePoint list report in several clicks, at most. All you have to do is to get to either a library or a specific list, and find an “Integrate” option sitting in the upper part of your screen (on the same row of features as “New”, “Share”, “Export”, etc.)
The “Integrate” menu would most likely have several different options available, but the one we’re looking for is “Power BI”. After clicking the “Power BI” option, you’ll be presented with another option called “Visualize the list”. This particular button uses the entirety of your currently opened SharePoint list to generate a basic report and open it in a new tab in your browser.
This new tab is already using Power BI to generate your future SharePoint list report, and you can also customize this report in several different ways. First of all, there is an upper limit for four different categories and three measures that you can show at a time in a single Power BI report. With that in mind, you can use the menu to the right of the report to add or remove particular fields to the report – it is as simple as checking and unchecking these lines.
Additionally, if your information is numerical, Power BI allows you to change the way the information is summarized using the “Summarize” pane that shows up when you hover over an option in the menu on the right side of the screen. Here, you can choose between:
- “Average”
- “Maximum”
- “Minimum”
- “Count”
- “Variance”
- “Median”, and several other options.
To make bigger changes to your SharePoint list report as a whole, you can use the “Edit” button located at the upper left part of the screen. Keep in mind that switching to edit mode is a one-way street, meaning that you won’t be able to access this page with quick report editing anymore – and Power BI itself warns you about it after you click on the “Edit” button.
After finalizing your changes to the report, you can use a “Publish to the list” button (located near the “Edit” button) to give a name to your report and get an option to share this report with your team. It would include all of the information that you’ve left in the report, but you won’t be able to find it in the usual library – it would be located in the same “Integrate” menu that you’ve used to generate this report, but now you’ll be able to see the report with the name you gave it directly under the “Visualize this list” button.
It should be noted that, while the “Visualize the list” functionality is included in the free version of Power BI, both the ability to publish the list for someone else to see and the ability to view someone else’s reports requires a Power BI Pro license.
Conclusion
Generating SharePoint list reports is not an impossible task – far from it, actually. There are both built-in and third-party solutions that can offer you different levels of functionality and customizability for your reports. It is worth noting that not all of these options would be available for any use case.
Some of these options would be only compatible with a standalone version of SharePoint (2013, 2016, or 2019), and others are flat-out discontinued (like PowerView, which was removed from both Microsoft 365’s Excel and Excel 2021, and now Power BI is the alternative for it).