In project management, a clear roadmap is essential for success. A project timeline provides this roadmap, outlining the sequence of tasks, their dependencies, and deadlines. This visual representation is crucial for effective task planning, allowing project managers to break down complex projects into manageable steps. More than just a schedule, a project timeline becomes a living document that facilitates deadline tracking, ensuring projects stay on course. Perhaps most importantly, it fosters team coordination by providing a shared understanding of project milestones and individual responsibilities.
This article will guide you through the process of creating effective project timelines, from initial planning to implementation. We’ll explore techniques for improving timeline accuracy and look at some of the best specialized project management tools. Specifically, we’ll examine how tools like Virto Kanban Board App and Virto Gantt Chart App for SharePoint Online & Microsoft 365 can streamline timeline management and enhance project success.
What Is a Project Timeline, and How Does It Work?
Before diving into the how-to, let’s establish a clear understanding of project timelines: their definition, their critical role in project management, and how they contribute to keeping projects on schedule. This foundational knowledge will empower you to leverage timelines effectively in your own projects.
Definition of a project management timeline
A project timeline is a visual representation of a project’s schedule, displaying tasks, milestones, and deadlines in chronological order. It serves as a roadmap for project managers and team members, providing a clear overview of what needs to be done, when it needs to be completed, and how different tasks relate to one another.
Project timelines are used for several key purposes:
- Planning and organizing tasks
- Setting realistic deadlines
- Identifying potential bottlenecks or conflicts
- Communicating project progress to stakeholders
- Coordinating team efforts
👉So, what is a project timeline? A project timeline is a strategic planning tool that outlines the sequence of tasks and events required to complete a project. It typically includes start and end dates for each task, dependencies between tasks, and key milestones. Project timelines can be represented in various formats, such as Gantt charts, flowcharts, or even simple lists, depending on the project’s complexity and the team’s preferences.
Importance of timelines in project management
Project timelines are indispensable in project management for several reasons:
- Tracking project progress: Timelines provide a visual benchmark against which actual progress can be measured. This allows project managers to quickly identify if a project is on schedule, ahead, or falling behind.
- Resource management: By clearly outlining when tasks need to be completed, timelines help in allocating resources effectively. This ensures that the right people and materials are available when needed.
- Task completion: Timelines break down large projects into manageable tasks with specific deadlines. This helps team members stay focused and motivated, increasing the likelihood of completing tasks on time.
- Risk management: By mapping out the entire project, timelines can help identify potential risks or conflicts early on, allowing for proactive problem-solving.
- Stakeholder communication: Timelines serve as an effective tool for communicating project status and expectations to stakeholders, keeping everyone aligned and informed.
👉What is a project timeline or timeframe? A project timeline and timeframe are closely related concepts in project management. The timeline refers to the visual representation of the project schedule, showing the sequence and duration of tasks. The timeframe, on the other hand, refers to the overall duration of the project—the period from the project’s start date to its end date. While the timeline provides a detailed view of individual tasks and their relationships, the timeframe gives a high-level overview of the project’s duration.
How to Create a Project Timeline and Improve Its Accuracy
In this section, we’ll explain how to create a project timeline and improve its accuracy. We’ll provide step-by-step instructions for creating a timeline, choosing a project timeline format, selecting a project management tool, and visualizing the timeline with the chosen tool.
How to create a project timeline?: Step-by-step guide to creating a timeline project
Creating an effective project timeline involves several key steps. Let’s explore each step in detail:
- Define the project scope and objectives
- Clearly outline what the project aims to achieve.
- Identify the project’s boundaries—what’s included and what’s not.
- Set SMART (Specific, Measurable, Achievable, Relevant, Time-bound) objectives.
- Document these in a project charter or scope statement.
- Identify all tasks and subtasks
- Break down the project into smaller, manageable tasks.
- Use techniques like Work Breakdown Structure (WBS) to ensure comprehensive coverage.
- Include all necessary steps, from initiation to closure.
- Be as detailed as possible to avoid overlooking critical activities.
- Determine task dependencies
- Identify which tasks need to be completed before others can start.
- Recognize different types of dependencies:
- Finish-to-Start (FS): Task B can’t start until Task A is complete.
- Start-to-Start (SS): Task B can’t start until Task A starts.
- Finish-to-Finish (FF): Task B can’t finish until Task A finishes.
- Start-to-Finish (SF): Task B can’t finish until Task A starts.
- Create a network diagram to visualize these dependencies.
- Estimate task durations
- Use historical data from similar projects if available.
- Consult with team members who will be performing the tasks.
- Consider using techniques like Three-Point Estimation:
- Optimistic time (O)
- Most likely time (M)
- Pessimistic time (P)
- Calculate: (O + 4M + P) / 6
- Account for potential risks and their impact on duration.
- Set milestones and deadlines
- Identify key project milestones – significant points or events in the project.
- Set realistic deadlines for these milestones.
- Ensure deadlines align with stakeholder expectations and project constraints.
- Consider external factors that might influence deadlines (e.g., market conditions, regulatory requirements).
- Allocate resources
- Determine what resources (people, equipment, materials) are needed for each task.
- Check resource availability and capacity.
- Assign resources to specific tasks.
- Be mindful of potential resource conflicts or overallocation.
- Create the timeline
- Choose an appropriate format (e.g., Gantt chart, network diagram).
- Plot tasks on the timeline, showing their start and end dates.
- Indicate task dependencies with arrows or lines.
- Highlight milestones.
- Show resource allocation if possible.
- Use color-coding for clarity (e.g., by team, priority, or status).
- Review and adjust
- Share the draft timeline with team members and stakeholders.
- Gather feedback and incorporate necessary changes.
- Check for potential bottlenecks or resource overallocation.
- Ensure the timeline aligns with the project’s overall objectives and constraints.
- Make adjustments to optimize the schedule.
- Get final approval from key stakeholders.
Creating a project timeline is an iterative process. As you progress through these steps, you may need to revisit earlier steps and make adjustments. The goal is to create a realistic, achievable timeline that will guide your project to successful completion.
👉 How do you plot a project timeline? Plotting a project timeline starts with choosing a format like a Gantt chart. List tasks vertically on the left, then create a horizontal time axis. Draw bars across this axis to represent task durations. Connect dependent tasks with arrows to show their relationships. Mark important milestones with distinct symbols. Finally, use color-coding to categorize tasks by team, priority, or status. This approach creates a clear, visual representation of your project’s schedule, making it easier to manage and communicate progress.
How to choose a project management timeline format
Selecting the right timeline format is crucial for effective project management. The choice depends on various factors, including project complexity, team preferences, and specific project requirements. Let’s explore some common formats in detail:
- Linear timeline
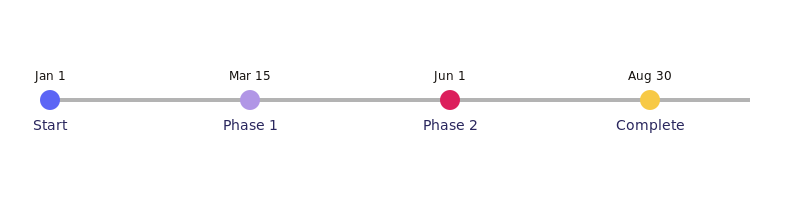
Pic. 1. Project plan timeline example.
- Characteristics: A simple, straight line showing events in chronological order.
- Best for: Simple projects with sequential tasks and few dependencies.
- Advantages:
- Easy to create and understand.
- Provides a clear overview of project progression.
- Good for high-level project summaries.
- Limitations:
- Doesn’t show task dependencies or resource allocation.
- Can become cluttered with too many tasks.
- Example use case: Planning a small event or a straightforward marketing campaign.
- Gantt chart
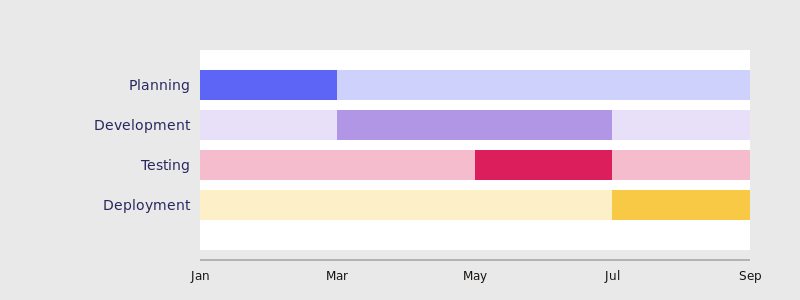
Pic. 2. Gantt chart project timeline.
- Characteristics: Horizontal bars representing tasks, their durations, and dependencies.
- Best for: Complex projects with many interdependent tasks and multiple resources.
- Advantages:
- Visualizes task dependencies clearly.
- Shows task durations and overlaps.
- Can display resource allocation.
- Helps identify the critical path.
- Limitations:
- Can become complex and hard to read for very large projects.
- Requires regular updates to remain accurate.
- Example use case: Software development projects or construction projects.
👉 Learn more about Gantt here:
- Gantt Chart for Microsoft Teams: A Tutorial & Overview of the Best Free Apps
- Gantt Chart vs Kanban Board
- Network diagram
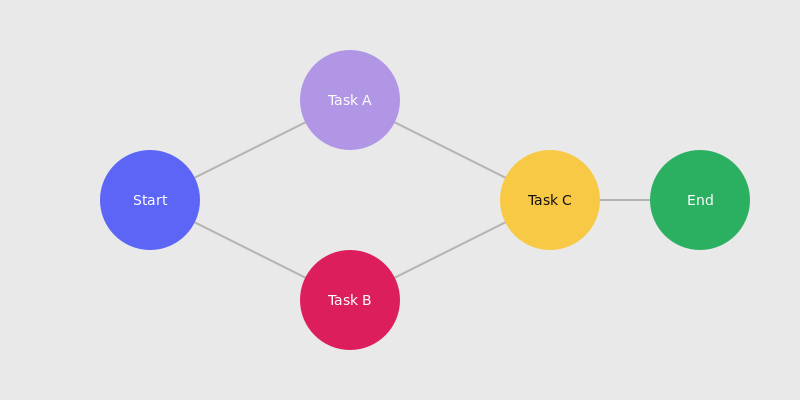
Pic. 3. Network diagram project timeline.
- Characteristics: A flowchart-like diagram showing tasks as nodes and dependencies as arrows.
- Best for: Projects where understanding task relationships is crucial.
- Advantages:
- Clearly shows task dependencies and workflow.
- Helps identify critical paths and potential bottlenecks.
- Useful for planning and scheduling optimization.
- Limitations:
- Doesn’t show task durations as clearly as Gantt charts.
- Can be complex for team members not familiar with the format.
- Example use case: Complex IT infrastructure projects or process improvement initiatives.
- Kanban board
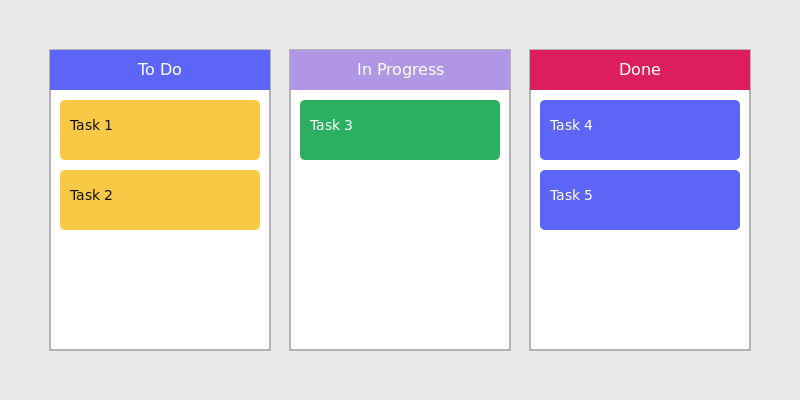
Pic. 4. Kanban board project timeline.
- Characteristics: A board divided into columns representing different stages of work.
- Best for: Projects with continuous workflows or agile methodologies.
- Advantages:
- Provides a clear visual of work in progress.
- Helps manage workflow and identify bottlenecks.
- Supports continuous improvement and agile practices.
- Limitations:
- Doesn’t show specific timelines or long-term scheduling.
- May not be suitable for projects with strict deadlines.
- Example use case: Ongoing software maintenance or product development in Scrum teams.
👉 Learn more about Kanban by following the links below:
- 16 Best Kanban Board Examples for 2024
- Practical Guide to Implementing and Measuring Kanban Metrics
- Comprehensive Guide to Setting Up Digital Kanban Boards
- Agile Kanban: Best Practices and Tools for Project Management
- Efficient Multiple Project Management with Kanban: An Expert Guide
- Calendar view
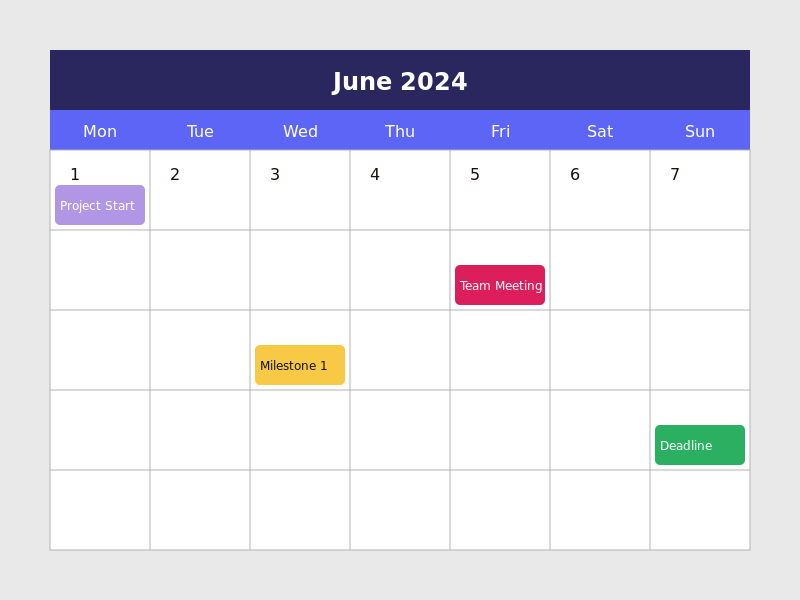
Pic. 5. Calendar view project timeline.
- Characteristics: Tasks and milestones displayed on a traditional calendar format.
- Best for: Projects with specific date-based milestones or time-sensitive tasks.
- Advantages:
- Intuitive and familiar format.
- Easy to see daily, weekly, or monthly workload.
- Good for deadline-driven projects.
- Limitations:
- May not show task dependencies clearly.
- Can become cluttered with too many tasks.
- Example use case: Event planning or marketing campaign management.
When choosing a format, consider these factors:
- Project complexity: More complex projects often benefit from Gantt charts or network diagrams.
- Team familiarity: Choose a format your team is comfortable with or can easily learn.
- Stakeholder preferences: Consider what format will be most effective for communicating with stakeholders.
- Project duration: Long-term projects might need different formats than short-term ones.
- Update frequency: Some formats (like Kanban) are easier to update frequently than others.
Remember, you’re not limited to using just one format. Many project managers use a combination of formats to get a comprehensive view of their project. For example, you might use a Gantt chart for detailed planning and a Kanban board for day-to-day task management.
👉 What is timeline or Gantt? A timeline is a chronological representation of events or tasks, while a Gantt chart is a specific type of timeline that shows tasks as horizontal bars on a time-based axis. Gantt charts also display task dependencies and often include resource allocation information.
Visualizing a timeline using project management tools
Modern project management tools have revolutionized the way we create, visualize, and manage project timelines. Let’s dive deeper into the process:
- Select a suitable tool
- Consider factors like:
- Project complexity
- Team size and distribution
- Budget
- Integration with other tools
- Popular options include:
- Microsoft Project: Robust, feature-rich for complex projects
- Asana: User-friendly, great for team collaboration
- Trello: Excellent for Kanban-style project management
- Jira: Ideal for software development projects
- Smartsheet: Spreadsheet-like interface with powerful project management features
- Consider factors like:
- Input your project data
- Enter tasks, ensuring each has:
- A clear, concise name
- Estimated duration
- Start and end dates
- Define task dependencies:
- Finish-to-Start (most common)
- Start-to-Start
- Finish-to-Finish
- Start-to-Finish
- Assign resources to tasks
- Set milestones for significant project events
- Enter tasks, ensuring each has:
- Use the tool’s timeline or Gantt chart feature
- Most tools offer multiple view options:
- Gantt chart
- Timeline
- Calendar view
- List view
- Experiment with different views to find what works best for your project and team
- Most tools offer multiple view options:
- Customize the view
- Use colors strategically:
- By team or department
- By priority level
- By project phase
- Group tasks:
- By project phase
- By team
- By priority
- Apply filters to focus on specific aspects:
- Tasks assigned to a particular team member
- High-priority tasks
- Tasks scheduled for a specific time period
- Use colors strategically:
- Share the timeline with your team
- Most tools offer sharing options:
- Direct access through the tool
- Exported images or PDFs
- Embedded views in other documents or webpages
- Consider access levels:
- View-only for stakeholders
- Edit access for team members
- Most tools offer sharing options:
Tips for improving visual clarity and accuracy of project timelines
As projects become more complex and stakeholders demand greater transparency, basic timeline creation is often not enough. To truly excel in project management, you need to leverage advanced techniques that enhance both the visual clarity and accuracy of your project timelines. These advanced tips go beyond the basics, helping you create timelines that are not just functional, but powerful tools for communication, decision-making, and project success.
In this section, we’ll explore strategies for color coding, task grouping, and data visualization as well as look into methods for improving estimation accuracy, handling uncertainties, and adapting your timeline to changing project conditions.
Tips for improving visual clarity in project management timelines
Here’re tips for improving visual clarity of your timelines:
- Use consistent color coding
- Develop a color legend and stick to it throughout the project
- Consider using color gradients for related tasks
- Ensure sufficient contrast for readability
- Be mindful of color-blind team members when choosing your palette
- Group related tasks effectively
- Use indentation to show task hierarchies
- Create summary tasks to encapsulate related subtasks
- Consider using swimlanes to separate different workstreams or teams
- Highlight critical paths and milestones
- Use distinct colors or shapes for critical path tasks
- Make milestones stand out with unique symbols or labels
- Consider adding vertical lines for key project dates
- Add task progress indicators
- Use progress bars within task bars
- Include percentage complete labels
- Use color changes to indicate task status (not started, in progress, completed, delayed)
- Include resource allocation information
- Show resource names or initials on task bars
- Use histograms or heat maps to visualize resource utilization
- Highlight over-allocated resources
- Optimize for different viewing contexts
- Ensure the timeline is readable when printed in black and white
- Create simplified versions for high-level presentations
- Design mobile-friendly views for on-the-go updates
- Use annotations wisely
- Add concise notes to explain complex dependencies or important decisions
- Use callouts to highlight key information without cluttering the main timeline
- Incorporate baselines
- Display the original plan alongside the current timeline to track deviations
- Use different line styles to distinguish between baseline and current plan
- Utilize zoom levels
- Provide both high-level and detailed views
- Allow users to easily zoom in on specific time periods or project phases
- Regular updates and maintenance
- Schedule regular reviews to ensure the timeline reflects the current project status
- Encourage team members to update their tasks regularly
- Use change tracking features to monitor and communicate timeline adjustments
👉 Why not explore a relevant use case? Check out the Team & Project Calendar.
Tips for improving project timeline accuracy
Here are some practical tips to enhance the accuracy of your project timelines:
1. Accounting for dependencies
- Identify all task dependencies upfront.
- Use dependency types correctly (Finish-to-Start, Start-to-Start, Finish-to-Finish, Start-to-Finish).
- Consider external dependencies (e.g., vendor deliveries, regulatory approvals).
- Use network diagrams to visualize complex dependencies.
- Regularly review and update dependencies as the project progresses.
2. Allocating resources
- Conduct a thorough resource assessment before timeline creation.
- Consider resource availability and capacity.
- Avoid over-allocation by spreading work across available resources.
- Account for part-time resources and shared resources across projects.
- Factor in holidays, vacations, and potential sick days.
- Use resource leveling techniques to optimize allocation.
3. Preventing delays
- Build in buffer time for unexpected issues (rule of thumb: 10-20% of total project time).
- Identify potential risks and develop mitigation strategies.
- Use critical path analysis to focus on tasks that directly impact the project end date.
- Implement regular check-ins and status updates to catch delays early.
- Have a change management process in place for scope changes.
4. Task estimation methods
- PERT (Program Evaluation and Review Technique): PERT is a statistical tool used in project management for analyzing and representing the tasks in a project.
- Uses three time estimates for each task:
- Optimistic time (O): Best-case scenario
- Pessimistic time (P): Worst-case scenario
- Most likely time (M): Normal scenario
- Calculate Expected time (E) using the formula: E = (O + 4M + P) / 6
- Provides a weighted average that accounts for uncertainty
- CPM (Critical Path Method): CPM is a step-by-step project management technique for process planning that defines critical and non-critical tasks to prevent timeline issues and process bottlenecks.
- Identify all tasks required to complete the project
- Determine task dependencies
- Create a network diagram of tasks
- Identify the critical path (the longest path through the network diagram)
- Focus on managing critical path tasks to keep the project on schedule
5. Additional tips for improving accuracy:
- Use historical data from similar projects to inform estimates
- Involve team members in the estimation process
- Break down complex tasks into smaller, more manageable subtasks
- Regularly update and refine estimates as more information becomes available
- Use rolling wave planning for long-term projects
- Implement time tracking to improve future estimates
- Conduct post-project reviews to learn from estimation successes and failures
6. Leveraging technology
- Utilize project management software with built-in estimation tools.
- Use Monte Carlo simulation for complex projects with many variables.
- Implement artificial intelligence and machine learning tools for pattern recognition in project data.
- Use collaborative platforms to gather real-time input from team members.
By following these steps and implementing these advanced tips, you can create a timeline that not only accurately represents your project plan but also serves as an effective communication and management tool for your entire team.
Analyzing data and adjusting timeline for projects
Effective project managers continuously analyze data and make informed adjustments to keep the project on track. This section will guide you through the process of analyzing project progress data, adjusting timelines, and using key performance indicators (KPIs) to track progress.
Analyzing project progress data
The key to effective timeline adjustments lies in data analysis. Here’s a breakdown of the process:
- Gather project data: Collect data from all relevant sources. This could include:
- Task completion rates: Track how many tasks are completed against the initial schedule.
- Resource utilization: Monitor how much time your team is spending on different tasks.
- Budget consumption: Analyze how quickly you’re moving through your allocated budget.
- Stakeholder feedback: Collect input from stakeholders on the project’s progress.
- Compare against the baseline: Compare the gathered data against your initial project plan. This will highlight areas where you’re ahead, behind, or on track.
- Identify variances and analyze causes: Determine the reasons for any discrepancies between your planned and actual progress. Common causes include:
- Scope creep: Uncontrolled expansion of project requirements.
- Resource bottlenecks: Delays caused by limited resource availability.
- External factors: Unforeseen circumstances like vendor delays or market shifts.
- Develop adjustment strategies: Based on the analysis, create action plans to address the identified variances:
- Timeline extensions: If delays are unavoidable, extend the project timeline realistically.
- Resource reallocation: Shift resources to critical tasks that are falling behind.
- Scope re-evaluation: Negotiate with stakeholders to potentially reduce or postpone non-essential tasks.
Key Performance Indicators (KPIs) for tracking progress in timeline project management
KPIs are crucial metrics that help you quantify project performance and progress. Here are some essential KPIs for project timeline management:
- Schedule Performance Index (SPI):
- Formula: Earned Value / Planned Value
- Interpretation: SPI > 1 indicates ahead of schedule, SPI < 1 indicates behind schedule.
- Schedule Variance (SV):
- Formula: Earned Value – Planned Value
- Interpretation: Positive SV indicates ahead of schedule, negative SV indicates behind schedule.
- On-Time Completion Percentage:
- Formula: (Number of tasks completed on time / Total number of completed tasks) x 100
- Helps track consistency in meeting task deadlines.
- Time to Market:
- Measures the time from project initiation to delivery.
- Crucial for projects where speed to market is critical.
- Milestone Hit Rate:
- Formula: (Number of milestones achieved on time / Total number of milestones) x 100
- Tracks success in achieving major project checkpoints.
- Resource Utilization:
- Formula: (Actual hours worked / Available hours) x 100
- Helps identify over- or under-allocation of resources.
- Estimation Accuracy:
- Formula: (Estimated time / Actual time) x 100
- Helps improve future project estimations.
Using KPIs to track progress in project planning timelines
Here are some additional tips for using the aforementioned KPIs, or any other KPIs for that matter, to track the progress of your project:
- Regular reporting:
- Create dashboards or reports that display KPIs clearly.
- Update KPIs at consistent intervals (weekly, bi-weekly, or monthly).
- Trend analysis:
- Look at KPI trends over time, not just single data points.
- Use trend lines to forecast future performance.
- Thresholds and alerts:
- Set acceptable ranges for each KPI.
- Implement alerts for when KPIs fall outside these ranges.
- Contextual analysis:
- Don’t analyze KPIs in isolation. Consider project context and how KPIs interact.
- For example, a high SPI might be good, but not if it’s achieved by sacrificing quality.
- Action planning:
- Use KPI insights to drive decision-making and corrective actions.
- Develop action plans for improving underperforming areas.
- Stakeholder communication:
- Use KPIs to provide clear, data-driven progress updates to stakeholders.
- Tailor KPI reporting to different stakeholder groups based on their interests and involvement.
By regularly analyzing project data, making informed timeline adjustments, and leveraging KPIs effectively, you can significantly improve your project’s chances of success. Remember, the goal is not to stick rigidly to the initial plan, but to adapt intelligently as the project evolves, always keeping the end objectives in sight.
Examples of Project Timelines
Understanding how project timelines work in different contexts can greatly enhance your project management skills. This section provides examples of timelines for various project types and industries, along with best practices from the community.
We’ve also included example Gantt charts for each type of project to provide a more detailed view of the project timelines, showing:
- The sequence of tasks
- The duration of each task
- How tasks overlap or run in parallel
- The overall project duration
The horizontal axis on a Gantt chart represents time (in months), while the vertical axis lists the main project phases. Each colored bar represents a phase, with its length corresponding to its duration. These Gantt chart illustrations offer a more standardized and detailed view of project timelines compared to simple bar charts. They better represent how real project management tools might display this information.
Project timeline examples: Examples of timelines for different types of projects
Project timelines vary significantly across industries and project types. Here are some examples:
IT projects: Software development (6-12 months)
Most often used in: Technology companies, IT departments across industries
- Requirements gathering and analysis (2-4 weeks)
- Design phase (4-6 weeks)
- Development phase (12-20 weeks)
- Testing and quality assurance (4-6 weeks)
- User acceptance resting (2-3 weeks)
- Deployment and go-live (1-2 weeks)
- Post-implementation support (4 weeks)
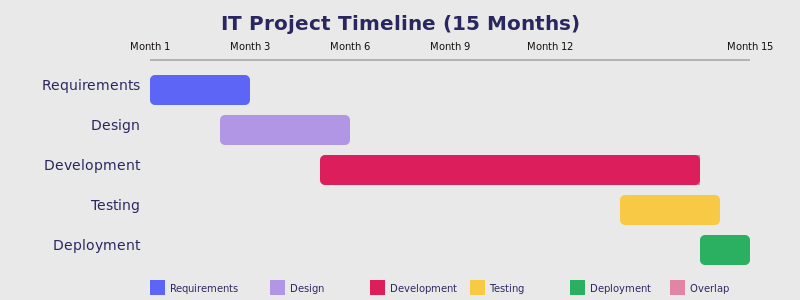
Pic. 6. Example timeline for projects in IT.
The above Gantt chart shows the progression of an IT project from requirements through deployment over a 15-month period, clearly displaying the long development phase and how testing overlaps with the end of development.
👉 Why not explore a relevant use case? Check out the Agile Project Management page.
Marketing Campaigns: Product Launch (3-6 months)
Most often used in: Marketing agencies, marketing departments in various industries.
- Market research and strategy development (4-6 weeks)
- Creative concept development (2-3 weeks)
- Content creation (4-6 weeks)
- Channel strategy and media planning (2-3 weeks)
- Asset production (4-6 weeks)
- Campaign setup and testing (1-2 weeks)
- Launch and initial monitoring (1 week)
- Ongoing optimization and reporting (4-8 weeks)
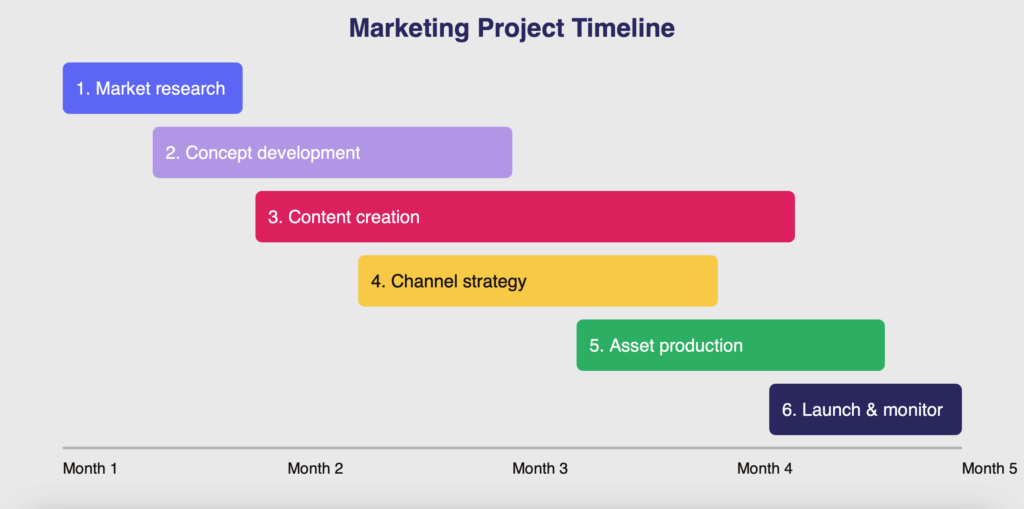
Pic. 7. Example timeline of a project in marketing.
The above chart illustrates the stages of a marketing project from market research to launch and monitoring over a 5-month timeframe. It also demonstrates how some phases, like concept development and channel strategy, overlap with content creation.
Product Development: Consumer Electronics (12-18 months)
Most often used in: Manufacturing, technology hardware companies.
- Concept development and market research (8-12 weeks)
- Product design and engineering (16-24 weeks)
- Prototyping (8-12 weeks)
- Testing and refinement (12-16 weeks)
- Manufacturing setup (8-12 weeks)
- Initial production run (4-6 weeks)
- Quality assurance and certification (4-6 weeks)
- Marketing and distribution preparation (12-16 weeks)
- Launch (1-2 weeks)
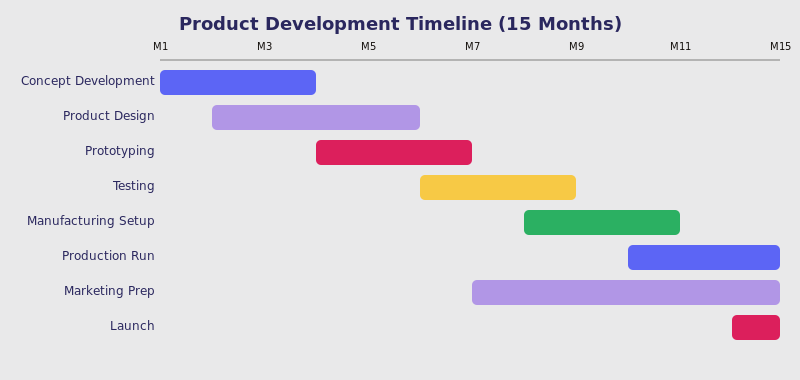
Pic. 8. Example timeline for a project in product development.
The above product development chart not only depicts the journey from concept development to marketing preparation over a 15-month period but also shows how marketing preparation begins well before the production run starts.
Construction: Residential Building (9-12 months)
Most often used in: Construction and real estate industries.
- Planning and permits (8-12 weeks)
- Site preparation and foundation (4-6 weeks)
- Framing (4-6 weeks)
- Exterior work (4-6 weeks)
- Interior rough-in (Plumbing, Electrical, HVAC) (6-8 weeks)
- Insulation and drywall (3-4 weeks)
- Interior finishes (Flooring, Painting, Fixtures) (6-8 weeks)
- Final touches and landscaping (3-4 weeks)
- Inspections and handover (2-3 weeks)
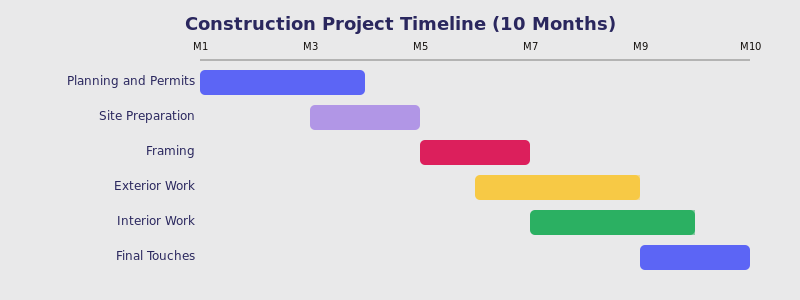
Pic. 9. Example timeline for project management in construction.
Finally, the above chart represents the stages of a construction project from planning to final touches over a 10-month timeline. It also illustrates the sequential nature of many construction tasks, with some overlap in later stages.
👉 How do you plan a project timeline example? Planning a project timeline involves defining objectives, breaking down tasks, estimating durations, identifying dependencies, allocating resources, and setting milestones. After creating a visual representation, like a Gantt chart, review with stakeholders and update regularly. For example, a website redesign project might span 16 weeks: Week 1 for kickoff, weeks 1-2 for research, weeks 3-4 for information architecture, weeks 5-8 for design and content creation, weeks 8-11 for development, weeks 12-13 for testing, week 14 for client review, week 15 for launch preparation, and week 16 for go-live and support. This breakdown illustrates how a complex project can be organized into manageable phases with clear timeframes.
Best practices and cases for timeline in project management
In this section, we’ll take a look at some of the best practices, tips, and advice we’ve gathered from the community of industry professionals.
Financial acumen in project timeline management
Jeffrey Zhou, CEO & Founder of Fig Loans, brings a unique perspective to project timeline management, leveraging his robust background in finance and business. His approach demonstrates how financial strategies can be effectively applied to optimize project timelines.
Zhou emphasizes the importance of clear goals and milestones:
“Having clear goals and milestones is a must for making timelines work. This method makes sure that the team is accountable and that the goals are aligned with the strategy. Just like financial planning needs to be checked on and changed on a regular basis, project timelines benefit from agile methods and tools that allow for real-time changes.”
This perspective highlights the parallels between financial planning and project management. Just as financial strategies require regular review and adjustment, project timelines need to be flexible and adaptable. Zhou’s emphasis on accountability and alignment with strategy speaks to the need for a holistic approach to project management.
Zhou also recognizes the value of technology in enhancing project efficiency:
“From what I’ve seen, using technology to automate routine jobs within project timelines not only makes things run more smoothly, but it also frees up resources for bigger, more important projects. Finding the right mix between structured planning and flexible management is important to make sure that projects stay on track even as business conditions change.”
This insight underscores the importance of leveraging technology to streamline processes. By automating routine tasks, teams can focus on more strategic aspects of the project. Zhou’s mention of finding the right balance between structure and flexibility is crucial, especially in today’s rapidly changing business environment.
Zhou concludes by tying project timelines directly to business outcomes:
“Basically, making sure that project timelines and budgets are in sync leads to strategic alignment and efficient execution, which are both important for meeting business goals and encouraging continuous growth.”
This final point connects project timeline management directly to business strategy and growth. It reinforces the idea that effective project management is not just about completing tasks on time, but about driving the business forward.
Zhou’s insights offer a valuable lesson: applying financial acumen to project timeline management can lead to more strategic, efficient, and growth-oriented project execution. His approach encourages project managers to think beyond the immediate timeline and consider the broader impact of their projects on the organization’s goals and financial health.
Precision in timeline projects: A marketing perspective
Sergey Taver, Marketing Manager at Precision Watches, draws parallels between the meticulous nature of watchmaking and the precision required in marketing campaign execution. His insights demonstrate how marketing principles can be effectively applied to optimize project timelines, particularly in event planning and product launches.
Taver emphasizes the importance of detailed planning and risk management:
“The best techniques for creating timelines include extensive planning and proactive risk management. Marketing efforts, like new product launches, benefit from clear objectives, timeline milestones, and measurable results. Visual tools like Gantt charts offer a full perspective of project dependencies and important milestones.”
This perspective highlights the critical role of thorough planning in project management, especially in marketing contexts. Just as a watchmaker must consider every gear and spring, a project manager must account for every task and dependency. Taver’s mention of Gantt charts underscores the value of visual tools in managing complex projects, providing a clear overview of the project’s structure and progress.
Taver also stresses the importance of communication and collaboration in project management:
“Excellent communication and stakeholder engagement are important in timetable management. Teams can better manage complexities and solve problems by encouraging collaboration and transparency. It is about establishing a shared vision and empowering team members to contribute their expertise to achieve common objectives.”
This insight resonates strongly with the collaborative nature of marketing campaigns. In both project management and marketing, success often hinges on effective communication and the ability to align diverse stakeholders towards a common goal. Taver’s emphasis on transparency and empowerment suggests a leadership style that values team input and fosters a sense of shared ownership.
Taver concludes by tying project timeline management directly to marketing outcomes:
“To summarize, strategic timeline management ensures exact execution and seamless collaboration, which are critical for delivering effective marketing campaigns and maximizing ROI.”
This final point brings the conversation full circle, connecting project timeline management directly to marketing effectiveness and return on investment. It reinforces the idea that effective project management in marketing is not just about meeting deadlines, but about delivering campaigns that achieve measurable business results.
Sustainable strategies in project timelines
Rain Yang, CEO & Founder of WoodenAve, emphasizes the integration of sustainable practices into strategic timeline development. His insights demonstrate how principles of sustainability can be effectively applied to optimize project timelines, particularly in manufacturing and supply chain management contexts.
Yang emphasizes the importance of incorporating sustainability into project schedules:
“I think that building sustainability goals into project schedules not only helps companies be more responsible, but it also improves brand image and customer loyalty. Businesses can be successful in the long run and have less of an effect on the environment if they use sustainable practices in every part of planning and carrying out a project.”
This perspective highlights the dual benefits of integrating sustainability into project management: enhancing corporate responsibility and improving market position. Yang’s approach suggests that sustainability should not be an afterthought but an integral part of project planning and execution, potentially leading to innovative solutions and improved processes.
Yang stresses the importance of balancing various business objectives:
“To make sure a business grows and stays strong, it’s important to find a balance between economic goals and social and environmental concerns. Aligning project timelines with environmentally friendly methods improves operational efficiency and stakeholder happiness. This is very important for reaching long-term business goals and building a strong company culture.”
This insight underscores the holistic approach needed in modern project management. By aligning project timelines with sustainability goals, Yang suggests that companies can achieve operational efficiencies while also meeting broader societal expectations. This approach not only contributes to long-term business success but also helps in fostering a positive company culture centered around responsibility and innovation.
Yang also highlights the role of collaboration tools and visual management techniques in sustainable project management:
“Focusing on tools like Monday.com helps teams work together and be responsible, which is similar to setting up production schedules. Visual styles like Gantt charts make it easy to keep track of all the milestones and keep an eye on the whole project, which is very important for handling complicated projects with lots of stakeholders and dependencies.”
This final point emphasizes the practical aspects of implementing sustainable project management. By leveraging collaborative tools and visual management techniques, teams can better coordinate their efforts, track progress towards sustainability goals, and manage the complexities of projects with multiple stakeholders and dependencies.
Engineering timelines for success
In the world of precision engineering, even the slightest deviation can have significant consequences. Gavin Yi, Founder and CEO of Yijin Hardware, understands this implicitly. He emphasizes the critical role of structured project timelines in achieving both product quality and customer satisfaction.
Yi emphasizes the importance of leveraging project management tools and visual representations:
“Using strong project management tools like Jira improves the speed of workflow and the way tasks are prioritized, which is similar to making production schedules more efficient. Visual styles like calendar views make it easy to plan projects and assign resources, which makes conversation easier and the project run more smoothly.”
Yi’s approach suggests that the right tools and visual representations can significantly enhance workflow efficiency and resource allocation. By making project timelines more visually accessible, teams can improve communication and streamline project execution, much like optimizing a production line in precision engineering.
Yi stresses the importance of integrating Key Performance Indicators (KPIs) into project timelines:
“From my point of view, adding KPI-driven metrics to project timelines lets us make decisions based on facts and keep getting better. Teams can keep track of progress, find problems, and make necessary changes on time to meet project milestones and customer standards if they set clear goals and performance indicators. It’s about creating a culture of excellence and new ideas, where customer happiness and operational efficiency are the most important things.”
This insight underscores the data-driven approach common in engineering applied to project management. By incorporating KPIs into project timelines, Yi suggests that teams can make more informed decisions, identify issues proactively, and continuously improve their processes. This approach not only ensures that projects meet technical specifications but also aligns with broader business goals of customer satisfaction and operational excellence.
Yi concludes by tying KPI-integrated project timelines to competitive advantage:
“Aligning project timelines with KPI integration basically guarantees flexible management and the best results, which is very important for keeping a competitive edge and boosting business growth in the precision engineering sector.”
Yi’s insights offer a valuable lesson: applying precision engineering principles to project timeline management can lead to more data-driven, efficient, and high-quality project execution. His approach encourages project managers to think beyond immediate deadlines and consider how their project management practices can contribute to overall business excellence and growth.
Using Tools to Improve Timeline Management
In this section, we’ll explore two powerful VirtoSoftware tools that can significantly simplify and improve project timeline management: the Virto Kanban Board and the Virto Gantt Chart. These tools, designed for seamless integration with SharePoint Online and Microsoft 365, offer robust features to enhance project visualization, task management, and team collaboration.
Benefits of using Virto Kanban Board and Virto Gantt Chart for project management
Beyond seamless integration with your Microsoft environment, VirtoSoftware apps empower your team with:
- Visualized workflows: See your entire project at a glance with intuitive Kanban boards and Gantt charts, making tracking progress effortless.
- Enhanced collaboration: Break down silos and improve team communication with tools designed for seamless task coordination and shared understanding.
- Data-driven insights: Make informed decisions based on real-time project data. Gain instant visibility into progress and identify potential roadblocks early on.
Let’s explore each of those apps in more detail below.
Virto Kanban Board App
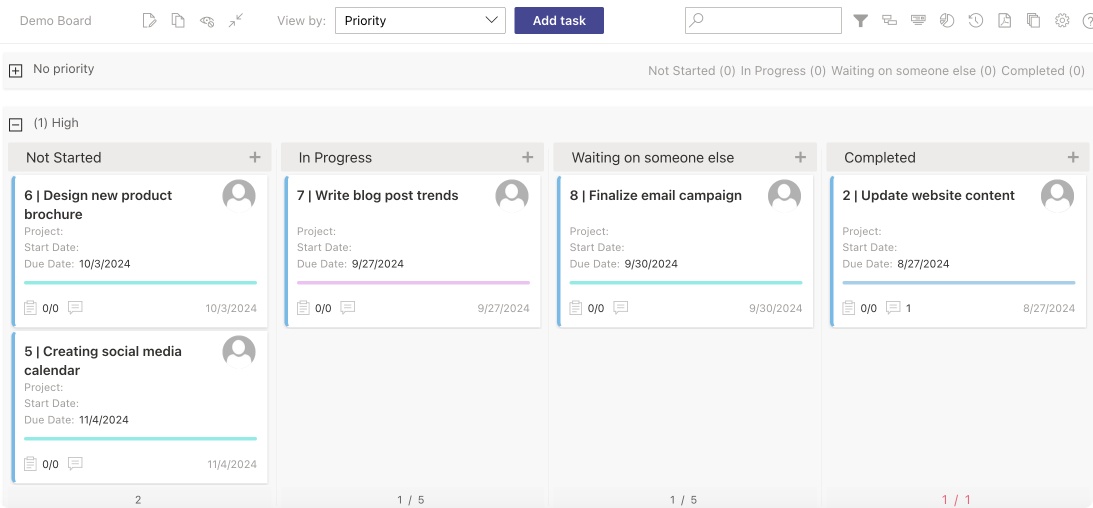
Pic. 10. The Virto Kanban Board app example view.
The Virto Kanban Board App transforms SharePoint lists into visually intuitive kanban boards, providing a clear overview of task progress and workflow.
Key features and benefits include:
- Flexible board creation:
- Create boards from existing SharePoint lists, quick boards, or templates
- Customize columns to represent your unique workflow stages
- Visual task management:
- Easily identify bottlenecks and blockers
- Drag-and-drop functionality for updating task status
- Swimlanes for task categorization:
- Group tasks by various criteria (e.g., assignee, project, priority)
- Customize swimlane behavior and appearance
- Customizable card information:
- Display relevant task details on cards
- Add up to three fields for the card title
- Work-in-progress (WIP) limits:
- Set maximum task limits for columns to prevent overload
- Dynamic updates:
- Automatic synchronization with SharePoint lists
- Option for dynamic swimlanes that adapt to list changes
Virto Gantt Chart App
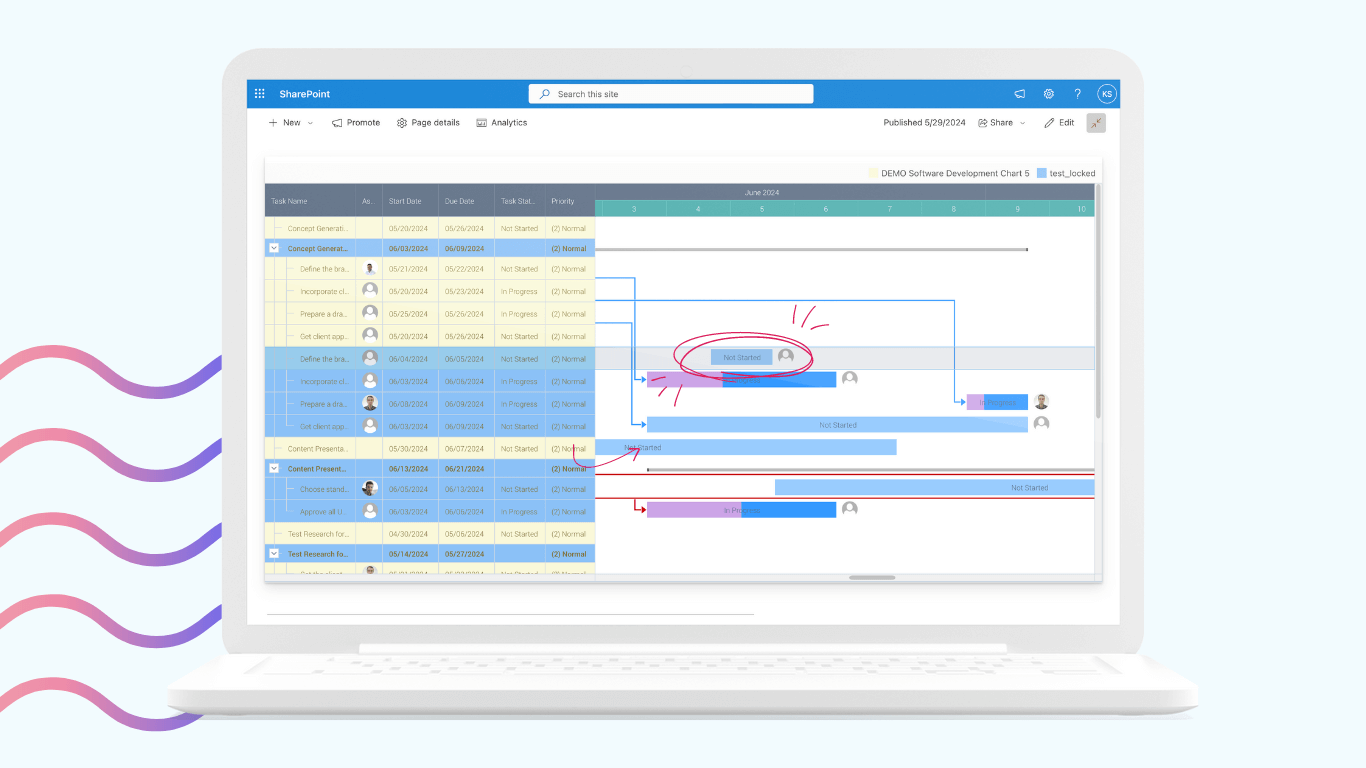
The Virto Gantt Chart App provides a comprehensive timeline view of projects, ideal for visualizing task dependencies and project milestones.
Key features and benefits include:
- SharePoint integration:
- Use SharePoint lists as data sources for Gantt charts
- Real-time visualization of project activities
- Interactive timeline management:
- Directly edit tasks, add dependencies, and set milestones
- Drag-and-drop functionality for timeline adjustments
- Resource management:
- Assign and manage resources directly within the chart
- View resource allocation across tasks and projects
- Customization options:
- Multiple view options (e.g., day, week, month)
- Color-coding for improved visual clarity
- Template functionality:
- Export and import chart templates for consistent project setups
- Enterprise-grade security and scalability:
- Ensures data integrity by adhering to strict Microsoft security protocols
- Adaptable to growing project complexity
Setting up notifications and integrations
To maximize the effectiveness of these tools, proper setup of notifications and integrations is crucial:
- Microsoft Teams integration:
- Add Virto Kanban Board and Gantt Chart as tabs in Teams channels.
- Enable real-time collaboration and discussions around project timelines.
- Email notifications:
- Configure automated email alerts for task assignments, due dates, and status changes.
- Customize notification frequency to balance information flow and avoid overwhelming team members.
- Power Automate integration:
- Create custom workflows triggered by board or chart updates.
- Automate repetitive tasks and notifications based on project milestones.
- SharePoint alerts:
- Utilize SharePoint’s built-in alert system for changes to underlying lists.
- Complement app-specific notifications with broader SharePoint updates.
- Mobile app notifications:
- Enable push notifications on mobile devices for critical updates.
- Ensure team members can stay informed on-the-go.
Need more info? Get the most out of your VirtoSoftware experience:
- Visit our Help Center: Our comprehensive documentation provides answers to frequently asked questions and step-by-step instructions: Learning Center.
- Contact our support team: Our dedicated IT professionals are ready to assist you with any technical enquiries or challenges via phone +1 (877) 892-7775, email [email protected], or Microsoft Teams chat.
Conclusion
Effective project timeline management is a cornerstone of successful project execution across all industries. Throughout this article, we’ve explored the fundamentals of creating and managing project timelines, delved into best practices from industry experts, and examined advanced tools that can streamline the process.
As projects become increasingly complex, leveraging the right tools can make a significant difference in your project management success. The Virto Kanban Board App and Virto Gantt Chart App for SharePoint Online and Microsoft 365 offer powerful features to visualize, manage, and optimize your project timelines. These tools can help you transform your project management approach, leading to improved efficiency, better resource allocation, and ultimately, more successful project outcomes.
We encourage you to explore these tools and see how they can enhance your project timeline management. Remember, the key to effective project management lies not just in the tools you use, but in how you apply them to your unique project needs and organizational culture.
- Schedule a quick demo to see both apps in action and ask your burning questions
- Try Virto Kanban Board App & Virto Gantt Chart App for free for 14 days
For further reading and resources on project and timeline management, consider the following:
Official Microsoft resources:
Our blog articles: