Efficient project management is the bedrock of successful enterprises, and SharePoint has become a go-to tool for many businesses using the Microsoft ecosystem. With its diverse capabilities, SharePoint is perfect for handling most project management needs. However, to unlock its full potential, integrating third-party applications tailored for specific tasks is often essential. In this article, we will look at how SharePoint becomes a real project management powerhouse when boosted with high-quality apps.
Introduction
Microsoft SharePoint brings together an array of dynamic features, offering a unified platform for collaboration, task management, and document sharing. However, while SharePoint Online and On-premises offer a solid foundation, businesses often seek to customize its capabilities. This is where third-party vendors come into the picture. Among these, VirtoSoftware stands out as a leading provider, offering a suite of tools designed to elevate SharePoint’s features.
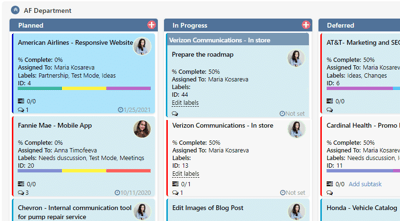
VirtoSoftware’s flagship product, Virto Kanban Board, adds an extra layer of efficiency to SharePoint project management. It offers a visual and intuitive approach, facilitating project control and progress tracking.
This article will delve into SharePoint’s project management capabilities, why and how to set up an effective project management system, and why you should consider using kanban boards for your daily task management. So let’s dive in and revolutionize your SharePoint project management journey.
Understanding SharePoint for Project Management
SharePoint is more than just a platform for storing documents—it’s a sophisticated system that assists in coordinating projects. Whether you’re a project manager or an IT professional, SharePoint provides the tools and features you need to plan, implement, monitor, and finalize projects successfully. From creating an organized workspace for team members to setting up automated workflows, SharePoint can streamline every aspect of project management.
SharePoint’s project management features
Thanks to its core built-in features, SharePoint is considered a comprehensive project management solution. Here, we outline eight of the critical features that cater specifically to project management requirements:
- Document management: SharePoint offers a centralized location for storing and managing documents. You can create document libraries, categorize files, and manage versions, ensuring all team members have access to the latest documents.
- Task management: SharePoint allows you to create and assign tasks, set deadlines, and track progress, providing a clear overview of the project’s flow.
- Team sites: SharePoint’s team sites are collaborative workspaces where team members can share documents, communicate, and work together on tasks.
- Communication and collaboration: SharePoint promotes effective team communication through features like news posts, discussion boards, and @mentions.
- Calendar integration and scheduling: SharePoint integrates with Outlook, allowing you to schedule meetings, set reminders, and keep track of deadlines.
- Version control: SharePoint’s version control feature ensures that everyone is working on the latest version of a document, preventing confusion and errors.
- Security and permissions: SharePoint allows you to control who can access specific documents, sites, or features, protecting sensitive information and maintaining order.
- Workflow automation: With SharePoint, you can automate common tasks and processes, saving time and preventing burnout from tedious manual tasks.
SharePoint for Project Management: Key Benefits
Let’s explore the most important advantages of SharePoint and examine how they can improve your project management practices while looking at some real-life examples for various teams:
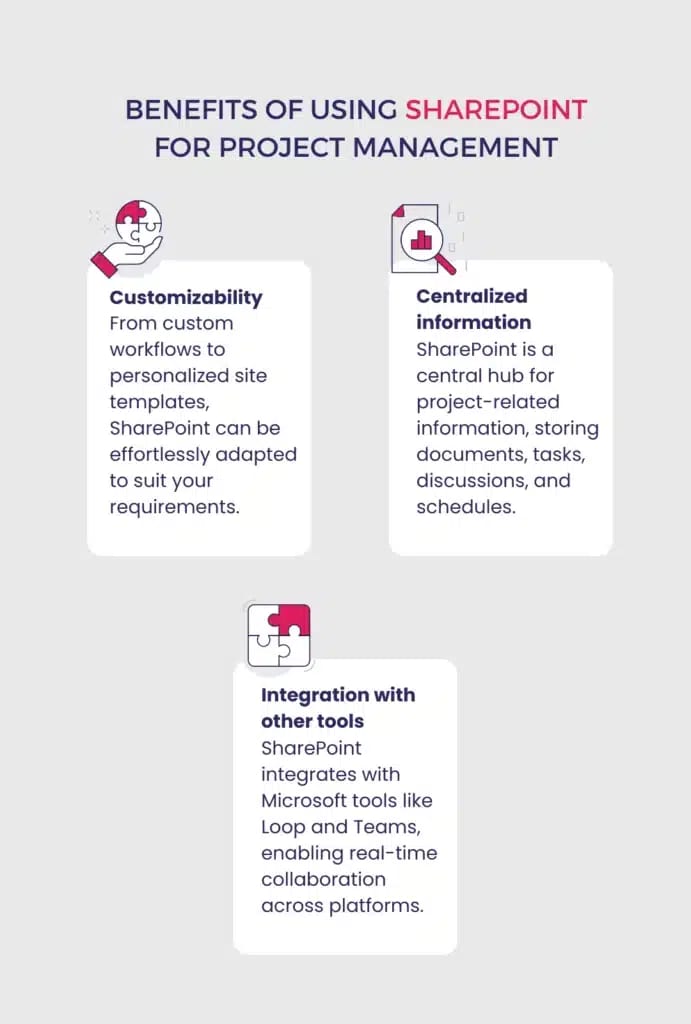
- Centralized information: SharePoint serves as a central repository for all project-related information. Documents, tasks, discussions, and schedules are stored and accessed from a single location, simplifying data management so that everyone on the team is on the same page. For instance, a marketing team can create a SharePoint site for their upcoming product launch campaign, where all plans, design assets, meeting minutes, and task lists are stored and easily accessible.
- Integration with other tools: SharePoint’s strength lies in its seamless integration with Microsoft tools such as Microsoft Loop and Microsoft Teams. Loop enhances collaboration with real-time content creation and editing directly within SharePoint or any other Microsoft 365 tool. When a project manager updates a project timeline in Microsoft Loop, these changes are instantly reflected in SharePoint, ensuring everyone involved has access to the most current timeline. Microsoft Teams, as a hub for communication, simplifies file sharing with SharePoint integration.
- Customizability: Every project and team is unique, and SharePoint is customizable and adaptable. From custom workflows to personalized site templates, you can tailor SharePoint to suit your requirements. A software development team, for instance, might customize their SharePoint site to include a bug tracking list and a feature request library to streamline development. And the best part is that this is quick and easy to do thanks to the extensive library of free templates in SharePoint and other Microsoft 365 tools.
Key Features
Among many key features of SharePoint for project management, it has some standout features that set it apart in the project management arena. Here’s how to supercharge your project efficiency:
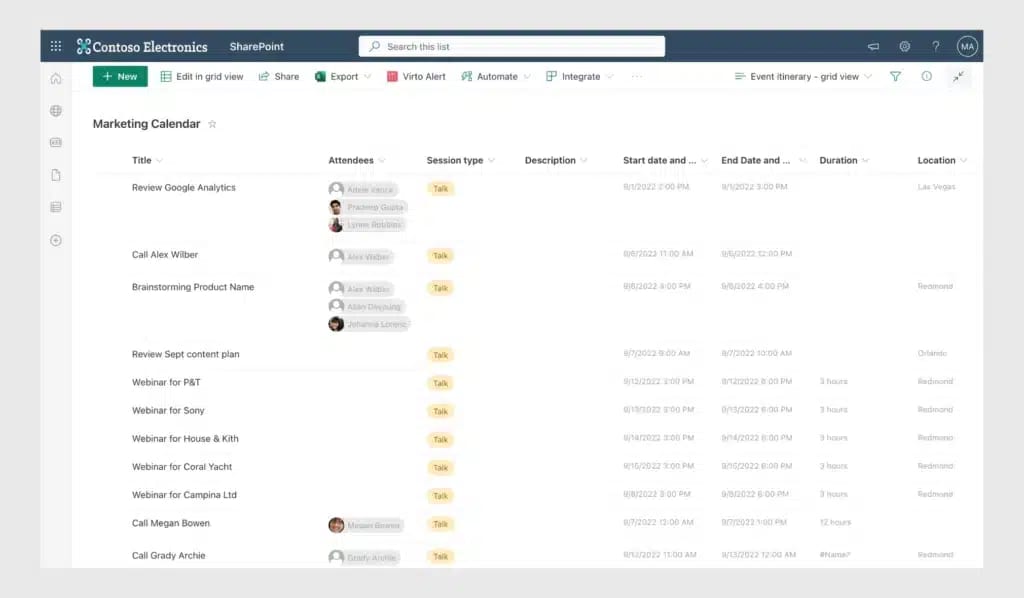
- Task lists: Task lists in SharePoint allow you to manage and monitor project tasks. With task lists, you can create, assign, and prioritize tasks; set deadlines; and track progress. But what makes SharePoint task lists truly powerful is its flexibility in views. You can customize the view to display tasks in various ways: a simple list, a detailed Gantt chart, or a task board for a kanban-like experience (read our article for a detailed comparison of Gantt charts and kanban boards). Thanks to this flexibility, every team member can view and manage tasks in a way that suits their preferences.
- Calendars: SharePoint’s calendar tool integrates seamlessly with Outlook and other Microsoft Exchange calendars, providing a comprehensive view of deadlines and meetings, and its notification system keeps you informed about upcoming events, reminders, and changes to the calendar.
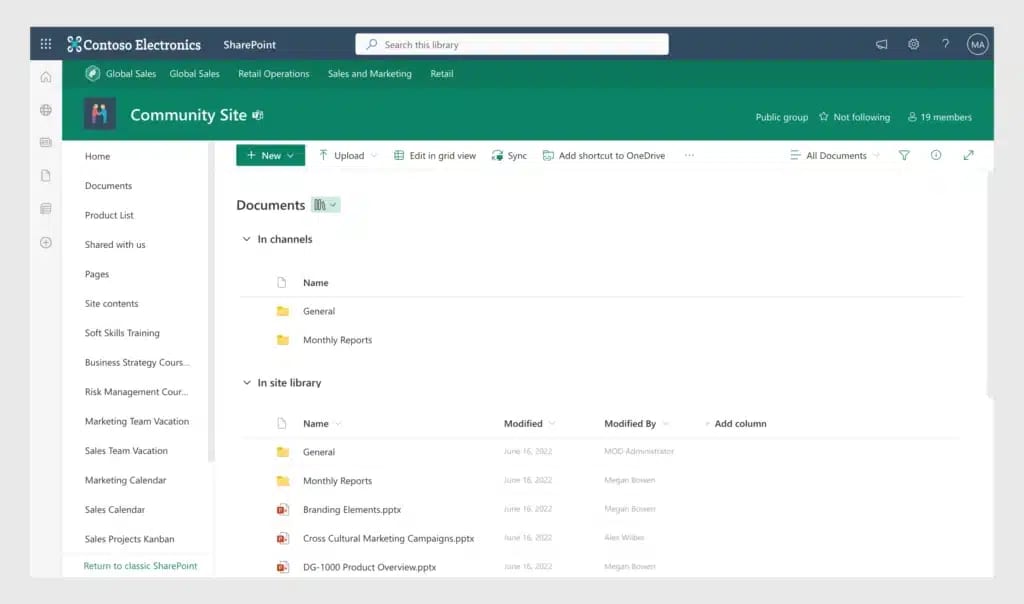
- Document libraries: Document libraries in SharePoint are centralized repositories for storing and managing project-related documents. These libraries enable version control, categorization, and secure sharing of files so all crew members can access the necessary resources whenever and wherever they need them.
- Team sites: SharePoint team sites serve as a collaborative workspace where team members can share documents, communicate, and work together on tasks. With team sites, SharePoint fosters collaboration and promotes transparency among project members.
- Workflow automation: SharePoint’s workflow automation feature enables project managers to automate repetitive tasks and processes, saving time and reducing the chance of errors. By setting up workflows for approval processes, notifications, and other routine tasks, you can focus more on strategic activities.
Project Management System Setup
Setting up a SharePoint project management system is not rocket science; on the contrary, it’s a rather quick and straightforward process. The time it takes depends on the complexity of your project and the level of customization you opt for. With our step-by-step instructions, you’ll be able to start reaping the benefits of SharePoint today!
Step-by-step instructions for setting up a project management system using SharePoint
Step 1: Create a new SharePoint site
Start by creating a new SharePoint site dedicated to your project. This will serve as the central hub for all project-related activities. Choose a site template that aligns with your project requirements, such as a team site or a community site:
- Team site: A team site is ideal for collaboration within a specific team or for a particular project. It offers features including document libraries, task management, and communication tools, enabling efficient teamwork and information sharing.
- Community site: A community site is a platform for discussions, idea exchange, and collaboration within a dedicated space. It includes features such as discussion boards, forums, and social networking capabilities.
There’s also an official SharePoint project management team site template that you can use right away to save you time and effort.
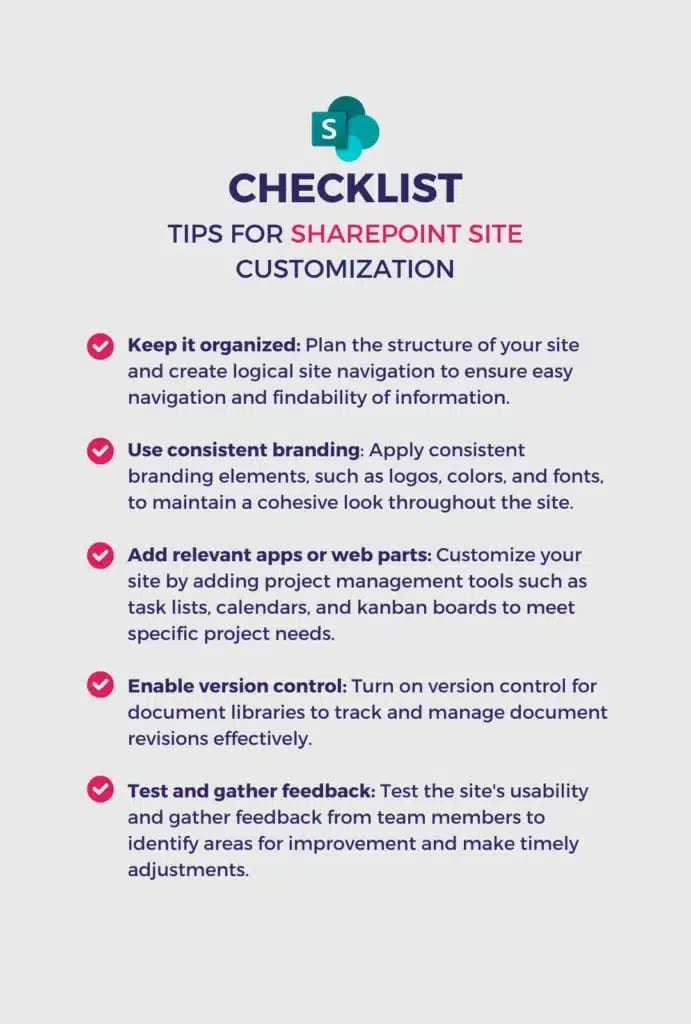
Step 2: Customize your site
Customize your SharePoint site to reflect your project’s requirements. Modify the site’s layout, add relevant web parts, and configure navigation to ensure easy access to key project information. For your convenience, we’ve created a checklist of the best tips for SharePoint site customization:
Step 3: Create document libraries
Create document libraries within your SharePoint site to organize and store project-related files. Define the structure and naming conventions that best suit your project’s needs. Consider creating separate libraries for different types of documents (not only different departments), such as proposals, contracts, or reports, to keep everything organized and easily accessible.
Step 4: Set up task management
Use SharePoint’s built-in task management capabilities to create and assign tasks, set due dates, and track progress. Here are some Microsoft apps and built-in SharePoint tools that you can use for different aspects of task management:
- SharePoint lists and views: SharePoint lists can be customized to track task progress. You can create columns to indicate task status (e.g., in progress or completed) and use different views to filter and track tasks based on their status. You can also add additional columns to capture relevant task details, such as priority, assigned team member, or due date. Use different views to filter and track tasks based on their status, priority, or other criteria.
- SharePoint calendar: SharePoint includes a calendar feature that allows you to set due dates for tasks and visualize them in a calendar view. By associating tasks with specific dates, you can easily identify upcoming deadlines and have a clear overview of your project schedule. You can also customize the calendar’s views and settings to display different time periods, color-code events, or overlay several calendars for better visibility. Watch our video to learn how to create a SharePoint calendar.
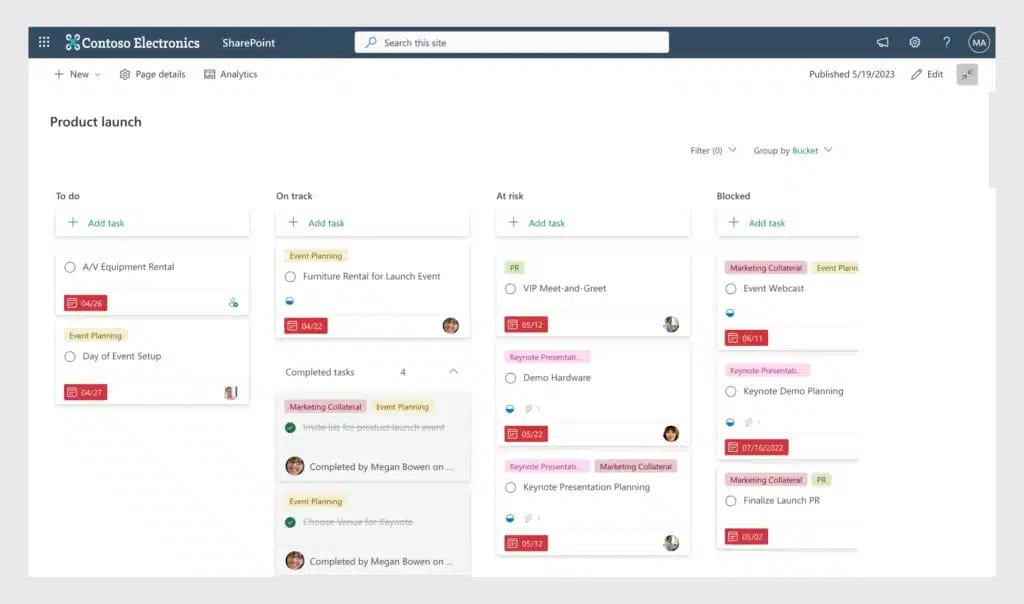
- Microsoft Planner: Planner is a task management tool that integrates with SharePoint. We can see it as a SharePoint kanban board that helps you to visualize and manage tasks, present data in various views (including dashboards, where you can see the overall status of your project), track task assignments, and monitor progress across different stages.
- Alerts and reminders: With SharePoint, you can configure notifications to keep team members informed about task updates and document changes. Enhance SharePoint’s default alerts with a powerful solution like Alerts and Reminders by Virto: this allows you to set up customized email and Teams channel notifications for task updates, document changes, or critical project milestones, delivering timely updates on a daily basis.
- Microsoft Teams: Teams is a collaboration platform that integrates with SharePoint. Within Teams, you can create dedicated channels for different projects or groups, allowing for focused discussions, file sharing, and task collaboration. But that’s not all: within each channel you can add overlaid calendars, integrate kanban boards for visual task management, and set up notifications to stay updated on project progress.
Managing projects in SharePoint with these Microsoft apps and built-in features is easy and convenient. Microsoft Teams, Planner, and the calendar features truly transform collaboration within a team.
Step 5: Integrate a SharePoint calendar
Integrate a SharePoint calendar into your project management system to track important dates, deadlines, and meetings. Use shared calendars to ensure everyone is aware of deadlines and leverage overlaid calendars with a feature-rich solution such as Virto Calendar Overlay to take your team’s planning to the next level.
Get started with SharePoint Calendar
Have your SharePoint Calendar ready in just 5 minutes.
Step 6: Implement SharePoint workflows
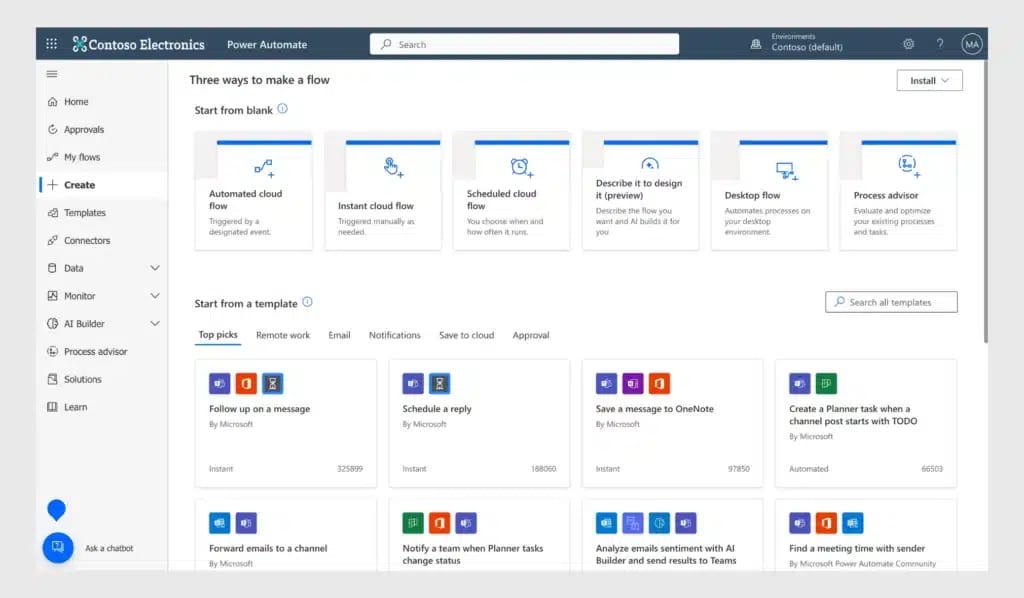
Implement SharePoint workflows or use Power Automate (formerly known as Microsoft Flow) to automate routine processes and streamline project workflows. Microsoft now recommends using Power Automate as they are gradually discontinuing workflows in older SharePoint versions. With Power Automate, you can create workflows for approvals, notifications, or document review processes to save time and improve efficiency. Design a workflow from scratch or use a rich template library to find what suits you best and set up a smooth flow in under a minute.
You may also want to consider some advanced Workflow Activities by Virto for admin-related activities like emails, list processing, permission processing, and document and attachment processing.
Step 7: Set permissions
Set permissions and access rights to make sure that the right individuals have appropriate access to internal information. Define user roles and groups and assign permissions to provide data security and confidentiality. This step is vital to maintain control over sensitive data within your company. In our documentation, you can learn more about how permissions in SharePoint work and how you can set up permissions for a SharePoint list. More extensive permission knowledge can be found on the official SharePoint website.
Step 8: Test and train
Before launching your project management system, we recommend you test the usability of each tool and workflow to make sure that the system meets your team’s requirements and to resolve any potential issues. Additionally, provide comprehensive training to team members so they are comfortable using the SharePoint-based project management system.
The above steps are a general guide, and the exact process may vary depending on your version of SharePoint and specific project needs. It’s always best to consult with a SharePoint expert or use training resources to ensure you effectively set up your project management system.
Any questions on buying and using?
Our support team is ready to guide you!
Best Practices for Setup and Management
When setting up a SharePoint project management system, it is vital to learn the best practices for doing it quickly and successfully. Here are some key guidelines to consider:
- Define objectives: Before setting up your project management system, clearly define your objectives, deliverables, and requirements. This will help you tailor SharePoint’s features and functionalities to meet your company or project’s needs.
- Involve stakeholders: Engage key stakeholders, including project managers, team members, and IT admins in the setup and management process. Collaborate to identify the most effective ways to improve features so that the system aligns with the expectations and workflows of everyone involved.
- Establish naming guidelines: Develop consistent naming conventions for sites, libraries, documents, and tasks within your SharePoint environment. This will enhance organization and searchability, making it easier for team members to locate and access the information.
- Regularly review and update: Schedule regular reviews of your system to ensure it remains relevant and is not cluttered or outdated. Regularly update site content, document libraries, and task lists to reflect the evolving needs of your project.
- Provide ongoing training: Offer comprehensive training to team members on using SharePoint’s project management features. Make sure they have practical knowledge on how to effectively collaborate, manage tasks, and search for information.
- Monitor and analyze usage: Use SharePoint’s analytics and reporting capabilities to track system usage and identify areas for improvement. Analyze data on site visits, document downloads, and task completion rates to gain insights into team productivity and project progress.
- Continually optimize: Seek feedback from team members to identify areas for improvement. Use this feedback to refine your SharePoint system, streamline your workflow, and optimize collaboration.
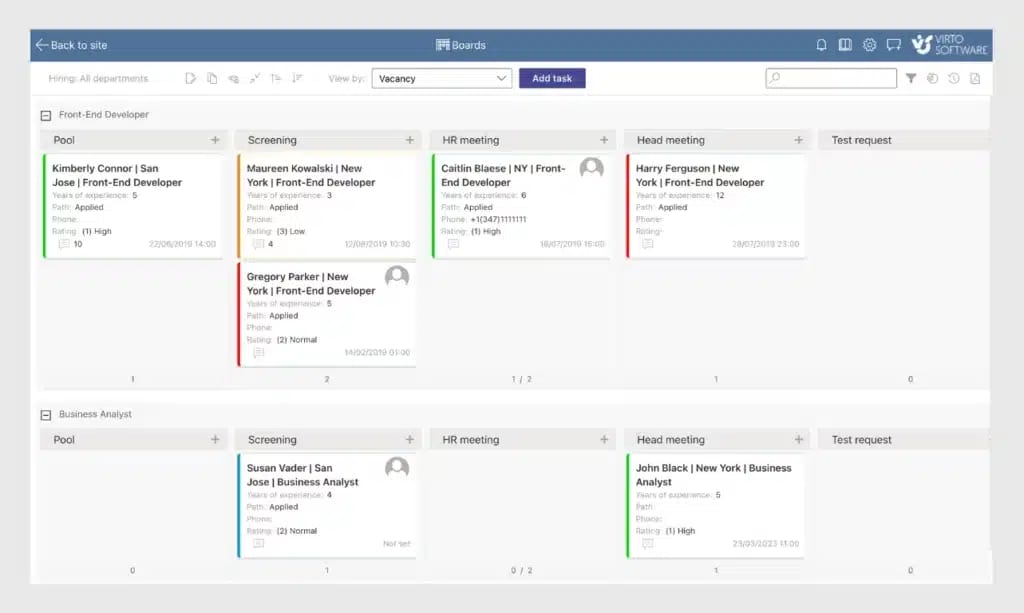
Efficiency with Virto Kanban Board
Efficient task management is vital for successful and time efficient project execution. With Virto Kanban Board, you can streamline your project management process while enjoying a feature-rich application. Virto Kanban Board enhances SharePoint’s capabilities by providing a visual and intuitive interface for managing tasks, improving collaboration, and tracking progress.
Overview of Virto Kanban Board and its Features
Virto Kanban Board is a robust app for SharePoint that revolutionizes task management with its comprehensive set of features. It offers a user-friendly interface with customizable boards, templates, subtasks and swimlanes, and, of course, highly-customizable cards, allowing you to visualize tasks based on their status, priority, or any other criteria. Key features of this SharePoint kanban board include:
- Drag-and-drop functionality for easy task movement
- Customizable card templates for capturing task details
- Color-coded labels for visual categorization
- Swimlanes and categories
- Task assignment and due dates for easy delegation
- Task comments and attachments
- Filtering and sorting options for quick task retrieval
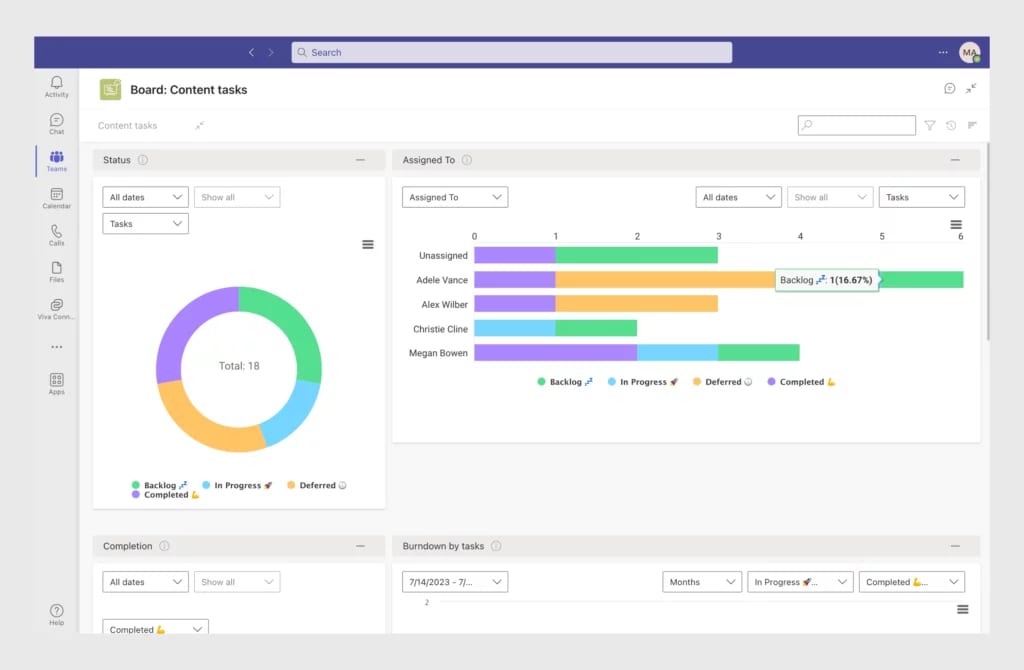
- Advanced analytics and reporting with charts
- Integration with almost all the Microsoft 365 apps, including Teams
- Mobile access
Watch our video to get a quick overview of all the Virto Kanban Board features.
Charts in Virto Kanban Board
Step-by-step guide: How to use Virto Kanban Board for project management
Using VirtoSoftware’s kanban board for SharePoint is straightforward. Here is a step-by-step guide to getting started with this powerful task management tool:
Configure the kanban board settings, such as board layout, card templates, and colors. We recommend watching the video on how to get started with Virto Kanban Board.
Create task cards on the kanban board, specifying task details, assignments, and due dates.
Set up notifications using the Alerts and Reminders app that comes with Virto Kanban Board. Configure customized email and Teams channel notifications for task updates, document changes, and any other project updates.
Customize swimlanes or categories to represent different stages or workflow phases.
Drag and drop task cards across swimlanes to reflect their progress. Use filtering and sorting options to focus on specific tasks or criteria.
Engage in team discussions and comments on task cards for collaboration and updates.
Leverage advanced analytics and reporting to track project performance and identify bottlenecks or areas for improvement.
Integrate Kanban Board with Microsoft Teams for seamless collaboration and enhanced communication.
Integrate Virto Kanban Board with Virto Calendar Overlay to synchronize task deadlines and project milestones with your SharePoint calendar for better visibility and coordination.
Get started with Kanban Board
Step up your project management game today.
Custom SharePoint Consulting & Training
VirtoSoftware offers comprehensive SharePoint consulting and training services to help users maximize their use of SharePoint and tools such as Kanban Board, Virto Calendar Overlay, Form Designer, and Workflow Activities.. Our team of experienced SharePoint consultants can provide expert guidance and support on optimizing your SharePoint environment, tailoring it to your specific business needs and ensuring smooth integration of applications.
- Assessment and planning: Our consultants conduct an assessment of your current SharePoint setup and identify points for improvement. We work closely with you to develop a plan to enhance your SharePoint environment and align it with your goals.
- Implementation and customization: We assist with site structure design, metadata planning, workflows, and other customization aspects to ensure a seamless project management experience.
- Migration: If you are looking to migrate from an older version of SharePoint or from another platform, our consultants can help you with a smooth and efficient migration process. We ensure that your data is securely transferred and your project management system is fully functional in the new environment.
- Training and user adoption: We provide comprehensive SharePoint training services to empower your team with the necessary skills and knowledge. We focus on user adoption strategies to ensure that your team embraces and makes full use of SharePoint.
Optimize your SharePoint usage with VirtoSoftware’s consulting and training services. Our team of experts is ready to guide you through the process, ensuring you get the most out of SharePoint services and third-party applications. Contact us today to get started!
Conclusion
In conclusion, SharePoint offers a robust platform for project management, providing centralized information, seamless integration with other tools, and customizability.
With Virto Kanban Board, SharePoint project management becomes more effective, enabling visual task management, streamlined coordination, and improved collaboration. Additionally, VirtoSoftware’s consulting and training services enhance the SharePoint experience, helping users optimize their use and maximize the benefits of the SharePoint kanban board and other tools.
Take the next step in revolutionizing your SharePoint project management by exploring Virto Kanban Board today. Unlock the full potential of SharePoint and empower your team to achieve success!